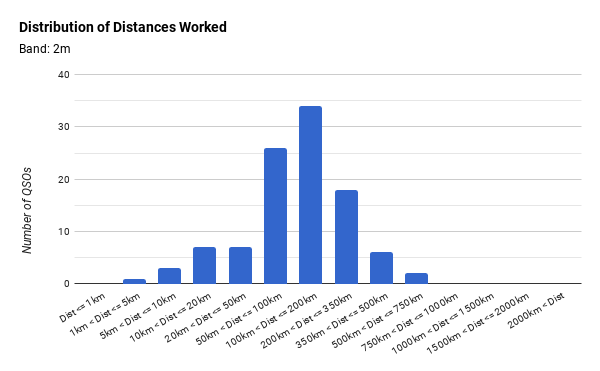
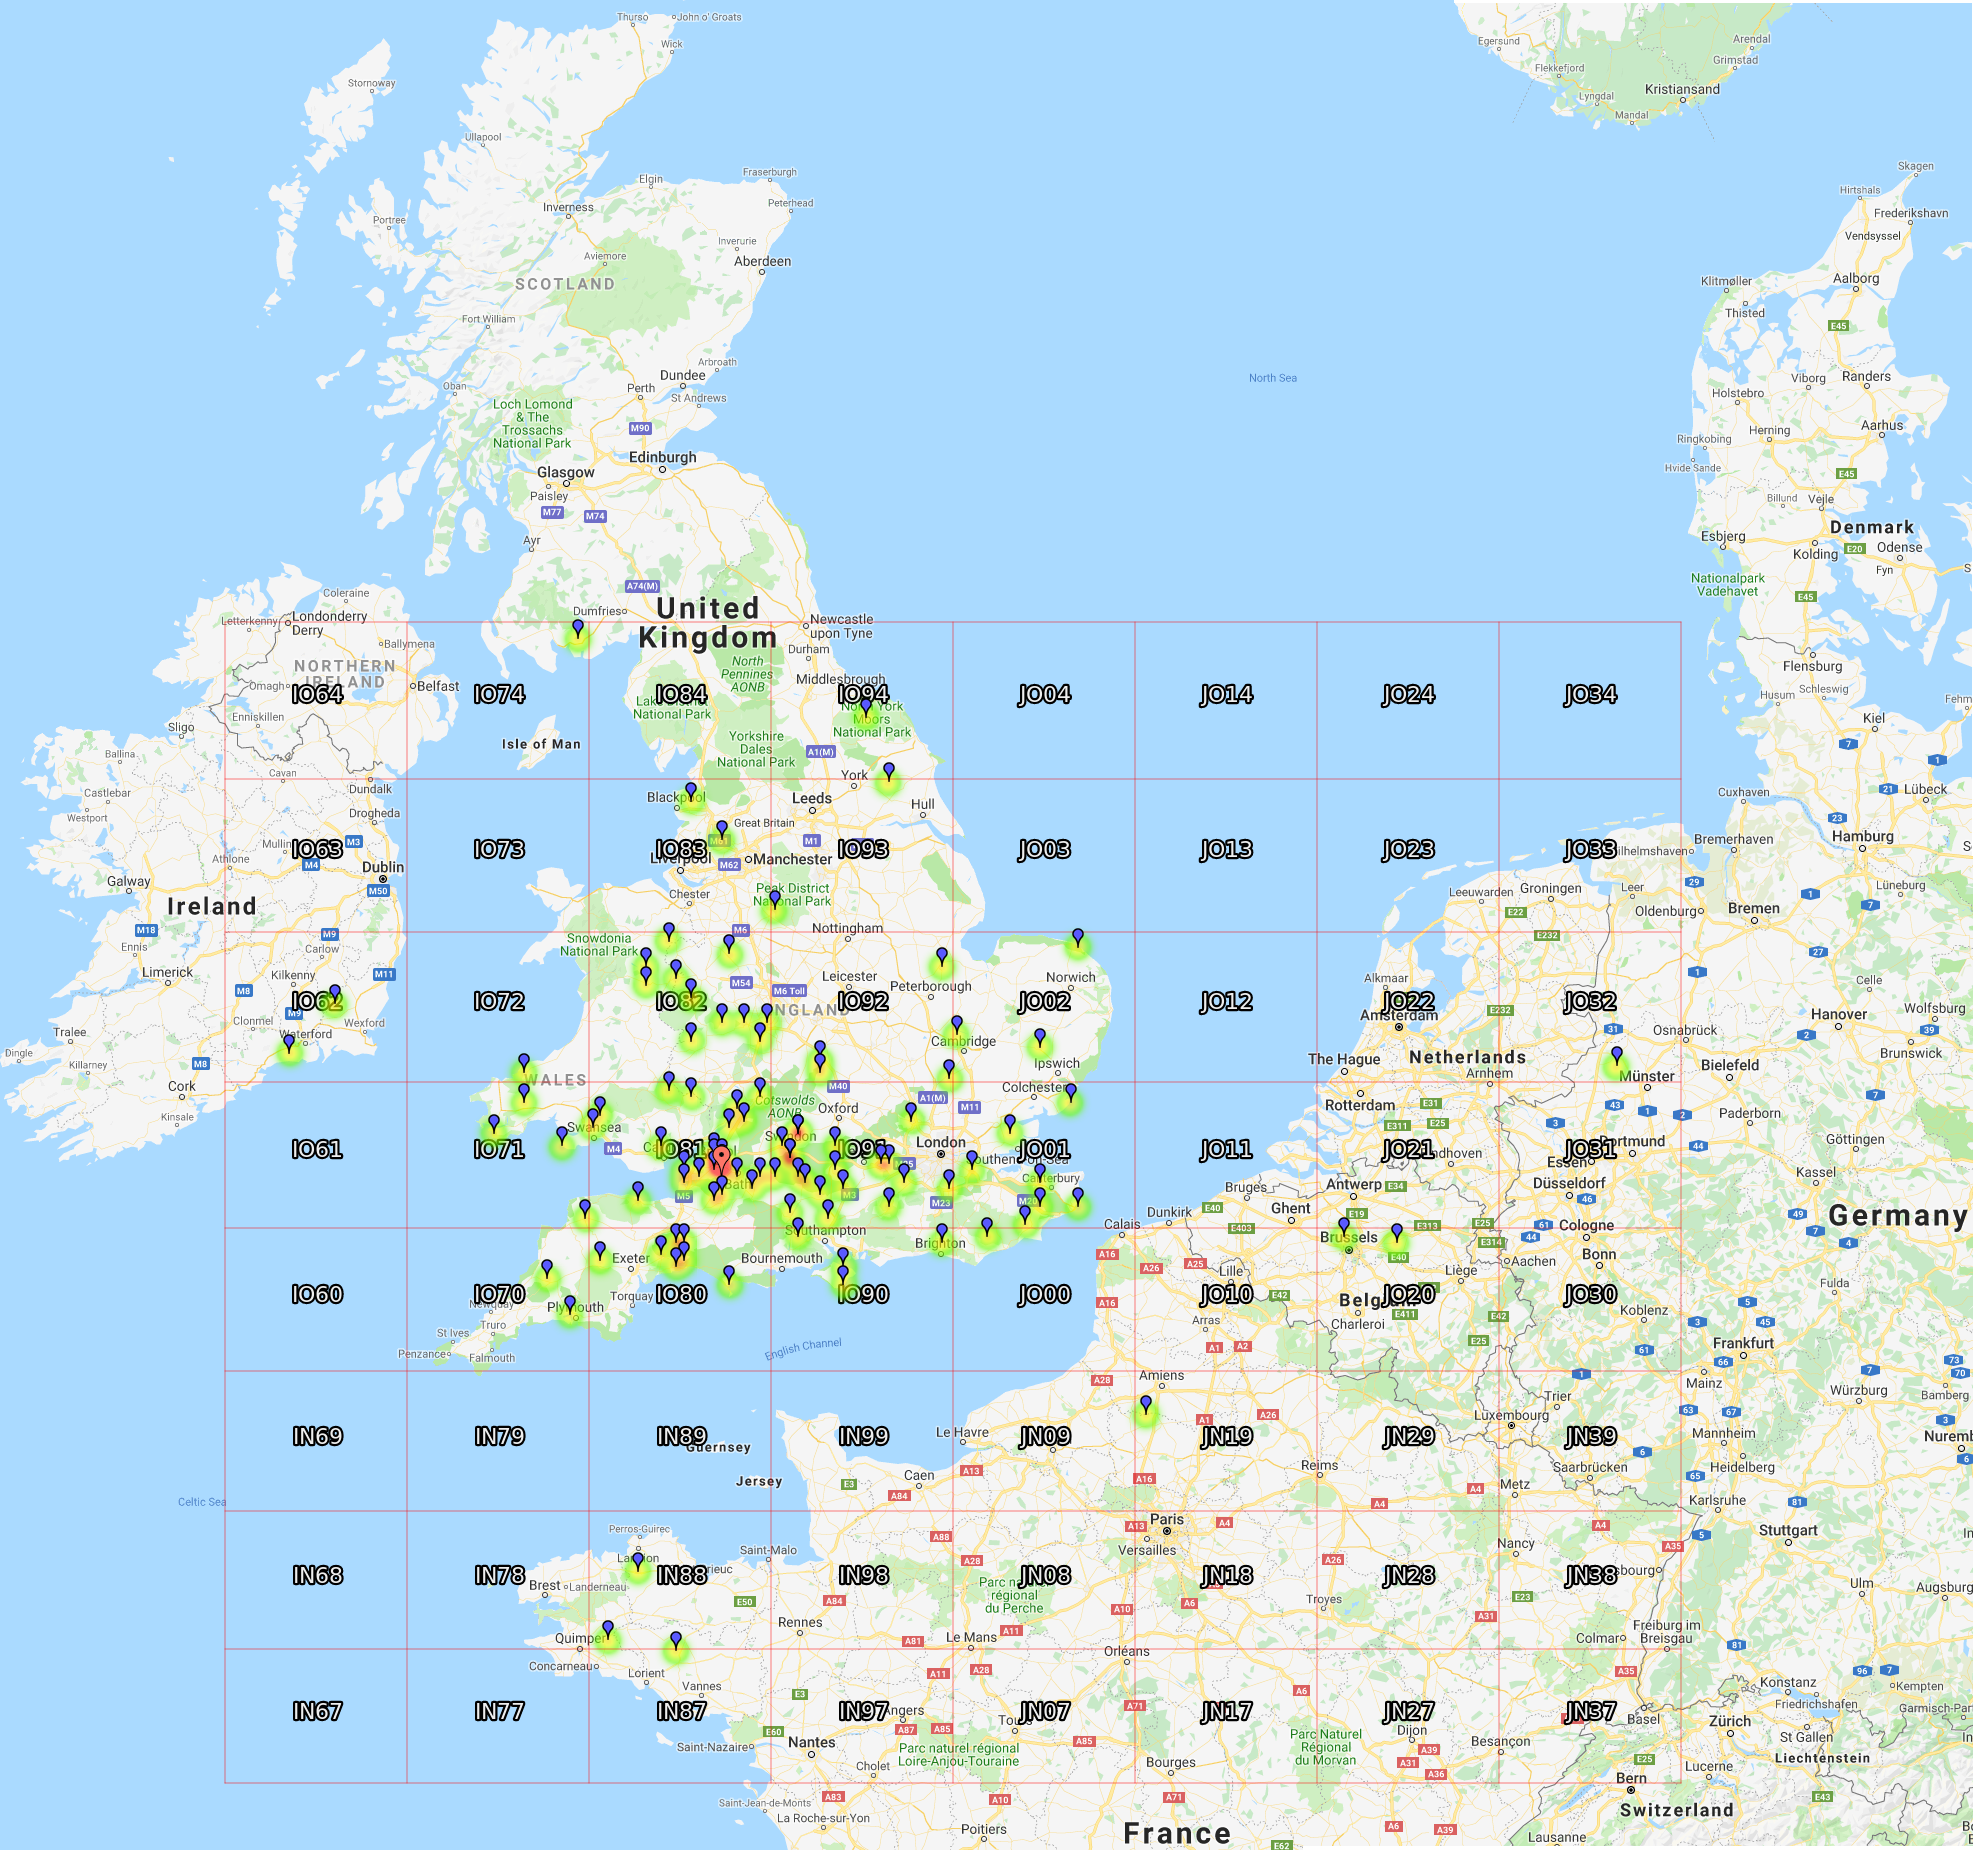
Location
Our location this year is situated in rural Bath and North East Somerset, although many would consider it simply to be Somerset. The site itself is just below 200m AOD (Above Ordnance Datum) and is one of the highest points in the area. To the immediate west is Blackberry Hill which peaks at 206m AOD and there is a trig point at 207m AOD to the west south west of our location, neither presented any particular impediment to our operation. To the south south east of the location there is a third peak around 205m AOD.

Introduction
Excitement, well I’m not sure it could actually be defined as excitement as such, but interest mounted early in the year when the possibility of operating a multi-band entry in this years Field Day was explored.
After some consideration and debate along with the necessary evaluation of where the additional kit might be borrowed from, since the Club equipment was fully committed to the regular 2m entry and we have no portable antennas for 4m, 6m or 23cm, it was decided that we would try to make an entry on 6m, 4m and 2m.
This was partly tactical, as regular readers of our exploits will be aware we spotted the potential for a very low number of contacts to potentially earn a high number of "normalised" points as the number of participants in our class on 4m were zero in 2018, and partly a recognition that overall class performance depends on a multi-band entry, and partly practicality since the timing of the 4m window means that it is relatively straightforward to enter 6m and 4m as the two operations don’t overlap. This allows equipment, specifically antennas, to be shared and more importantly the 6m operators on Saturday could become the 4m operators on Sunday leading to no additional manpower required on site.
The attentive amongst you will have spotted that we also eschewed our regular spot on Dundry Hill. This was a less tactical and more a "needs must" response to a late breaking problem. Over the last couple of years we have made use of a horsebox for Field Day accommodation. This has proven to be a very good base vehicle. It is large enough to allow comfortable operating with sufficient space around the operating area for equipment, changes of operators, observers whilst the "living" section provides a respite area in the event of inclement weather as well as basic catering facilities. Over the last couple of years sections of the "living" have been rebuilt to repair water leak damage as can be seen if you compare the facilities in 2017 with those in 2018.
This year another problem beset us; the horsebox was declared unroadworthy at its annual equivalent of the MoT and this time the extent of the repairs made it uneconomic to put it back on the road. The loss of our accommodation made the use of the Dundry Hill venue questionable as the call went out around the Club for alternative accommodations. Ultimately Paul 2E0GHT resurrected the Clutton DX Group operating post and arrangements were made to work from there.
A different location always provides a new set of problems, indeed it is only when a change of site occurs that the realisation dawns that the years of learning acquired at the old site will have to be dispensed with and a whole new set of local rules will have to be developed and adopted.
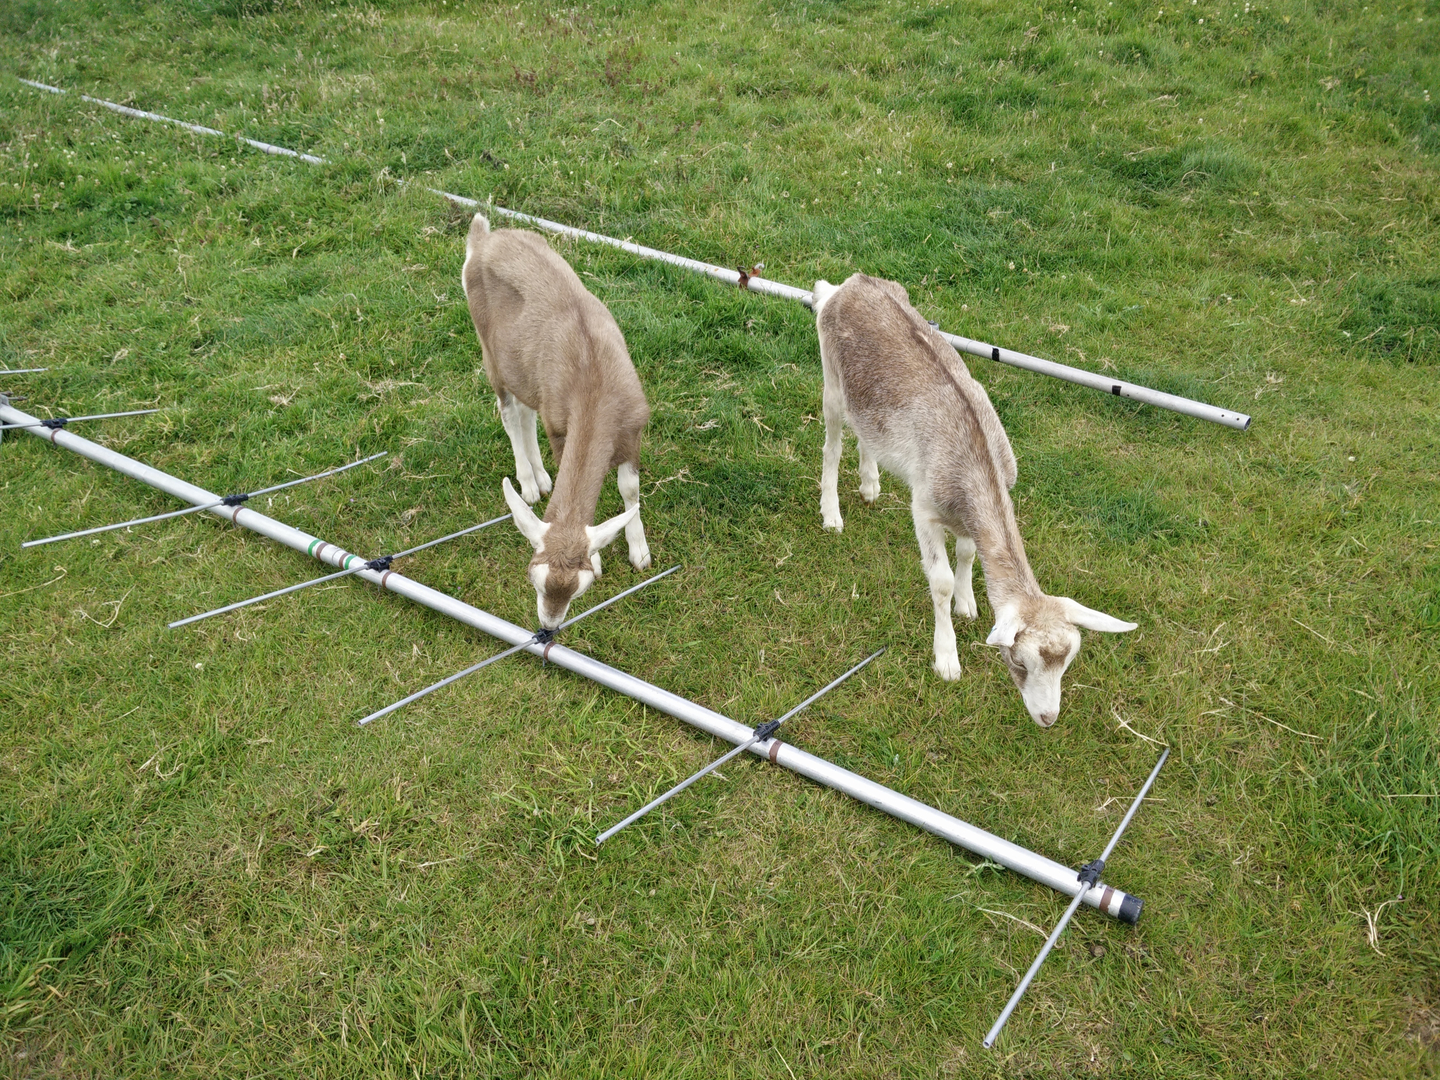
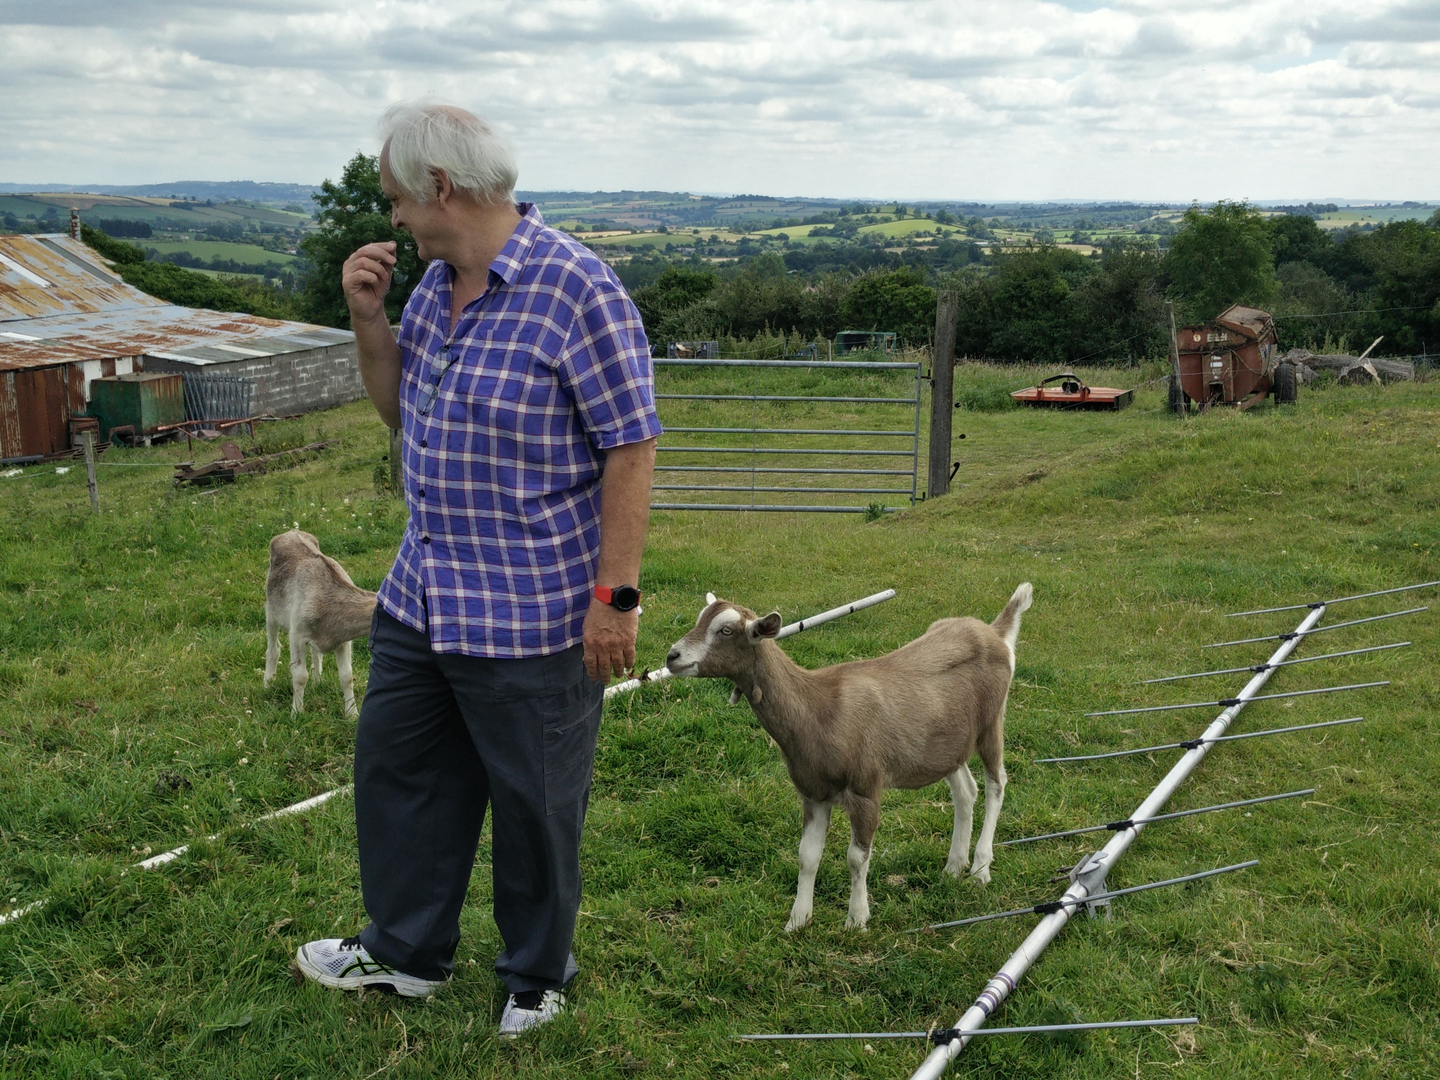
For us the biggest local "hazard" was the presence of goats! These lovely, inquisitive creatures have a tendency to explore everything new within their domain with their mouths and wherever remotely possible will endeavour to devour things. We had visions of feeders, rotator control cables, guy lines and potentially power cables all disappearing over the course of the weekend!
Our 2m setup followed the usual line up that we have successfully employed on Dundry for a number of years with the big 14 element beam going up on its tripod mast and connected to the Club rig. On 6m/4m we had borrowed a dual band Innovantennas 4 element beam from Ray G3IOI which was put up on a pole secured to a conveniently located telegraph pole that no longer supported any wires. All feeders and control cables were kept above human head height to make them inaccessible to the resident goats. The 6m/4m beam didn’t require guying being securely strapped to the existing but disused telegraph pole and the 2m beam was guyed back to the roof of the shack. We were, therefore, quietly confident that the installation was as goat proof as we could make it, and indeed other than an occasional nibble at the tailgate ramp we had no issues with livestock interfering with the equipment.
We did nickname one of the goats "Harry" as this one had a knack of being able to get outside the fenced paddock, we had to herd him back in on two separate occasions but aside from that the goats gave us no trouble what so ever.
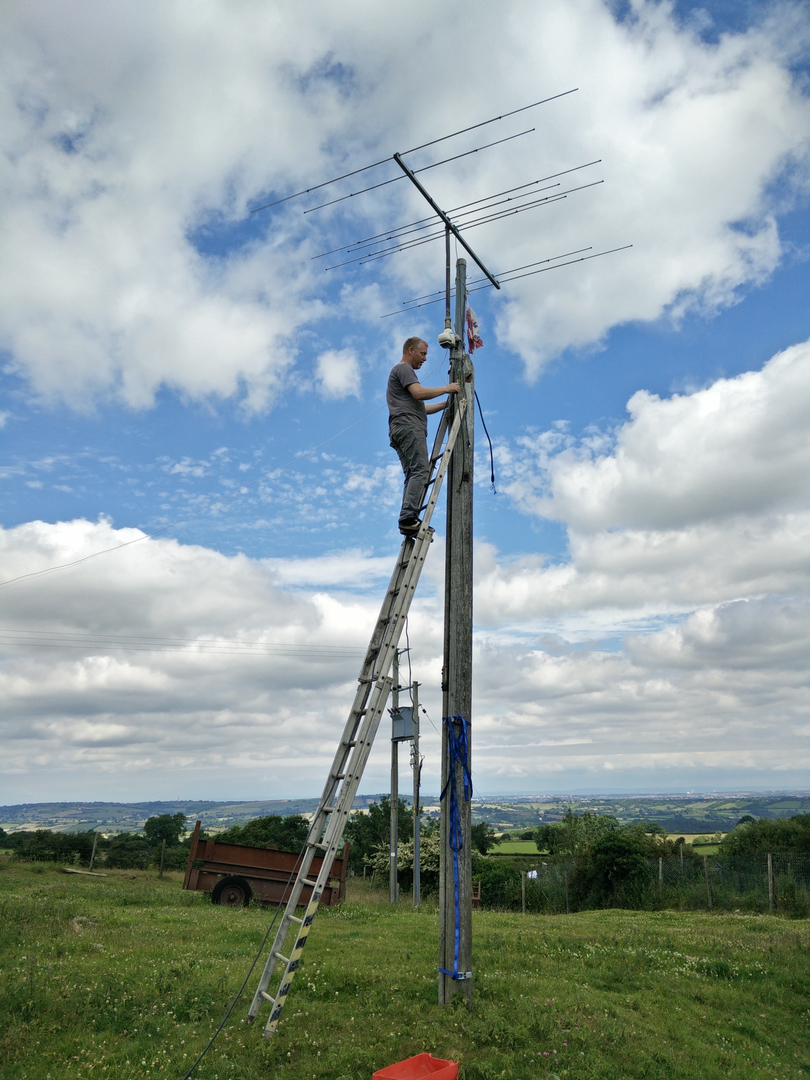
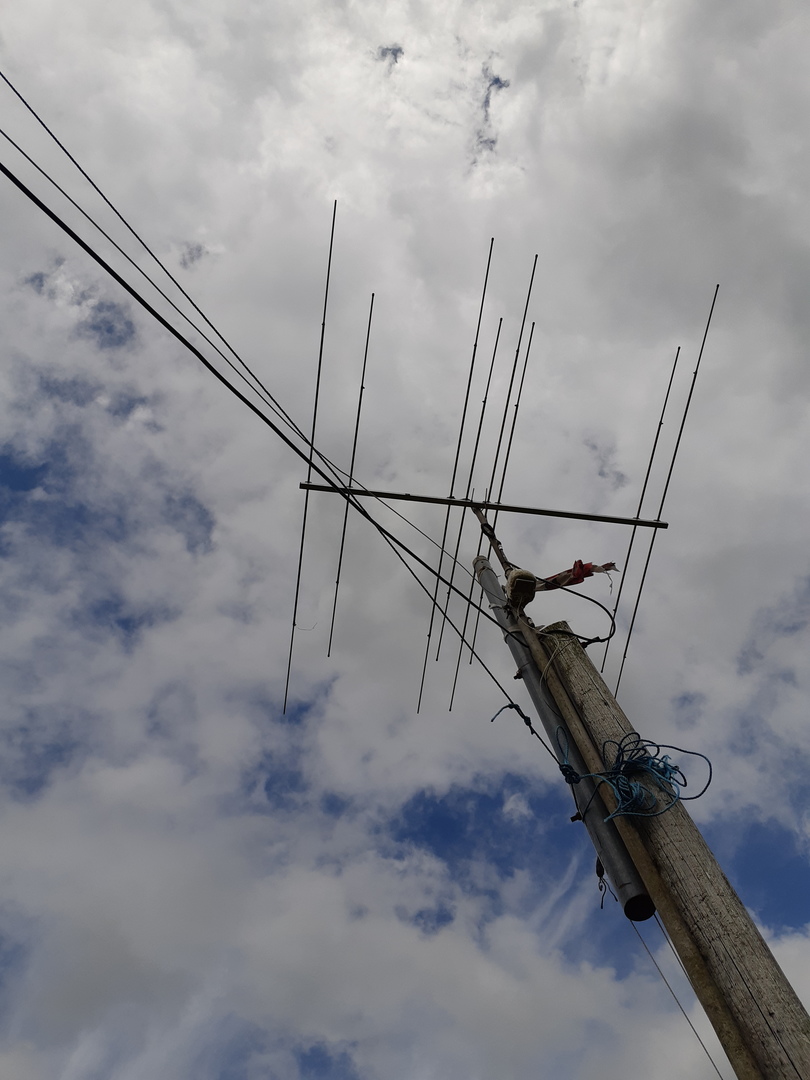
The change of venue meant that our set-up plans weren’t quite as well organised as we usually are, the local operators who were transporting the transceivers arrived some time before the 2m antenna. The team on site quickly rigged up a temporary 2m loop once they had put up the Innovantennas 4m/6m 4 element beam and spent a bit of time testing. On 2m they made a contact with an old friend in the Midlands who gave them a 55 signal report. After the beam arrived, was assembled and erected we re-contacted the same station and went from 55 to 59+20; yes gain is a wonderful thing!
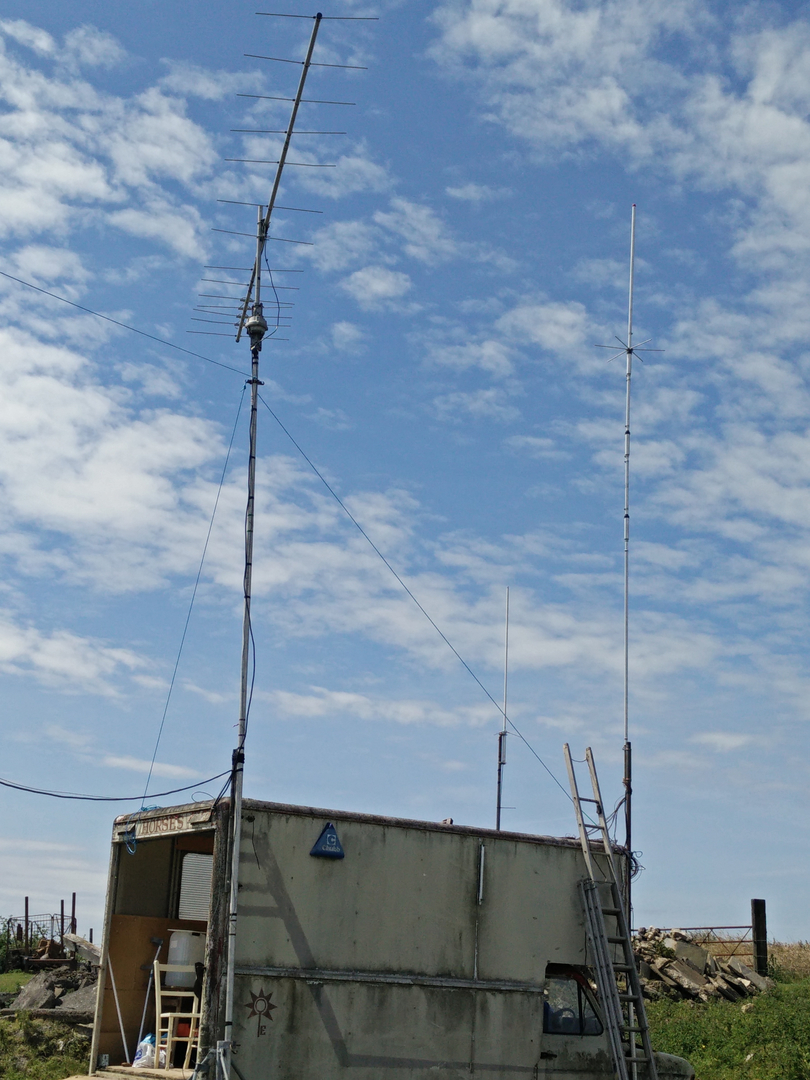
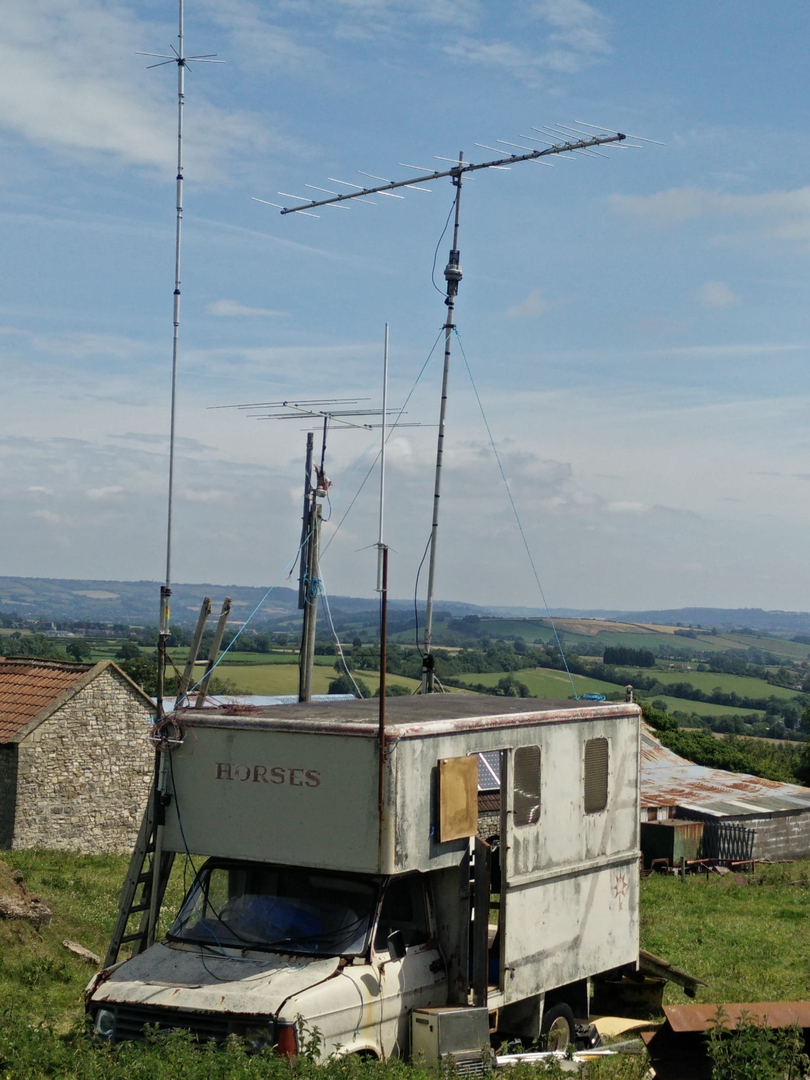
With everything in place we were ready for the off! Andy G7KNA and Mark M0SKV took the 2m station whilst David 2E0GZO and Paul 2E0GHT took the 6m station.
On 2m we saw similar trends to previous years, there was the usual flurry of contacts at the start of the contest until things settled down to a steady rate after about 4 hours. During this period in addition to the usual UK stations we worked into Ireland, France and Germany, securing our best DX for the weekend.
Being new to 6m we had no real preconceptions as to how things would develop. Initially the 2m and 6m stations were following very similar patterns with more or less the same QSO rates and similar destinations being reached. Belgium, France and Ireland were contacted in the first flurry of contacts which included the best DX.
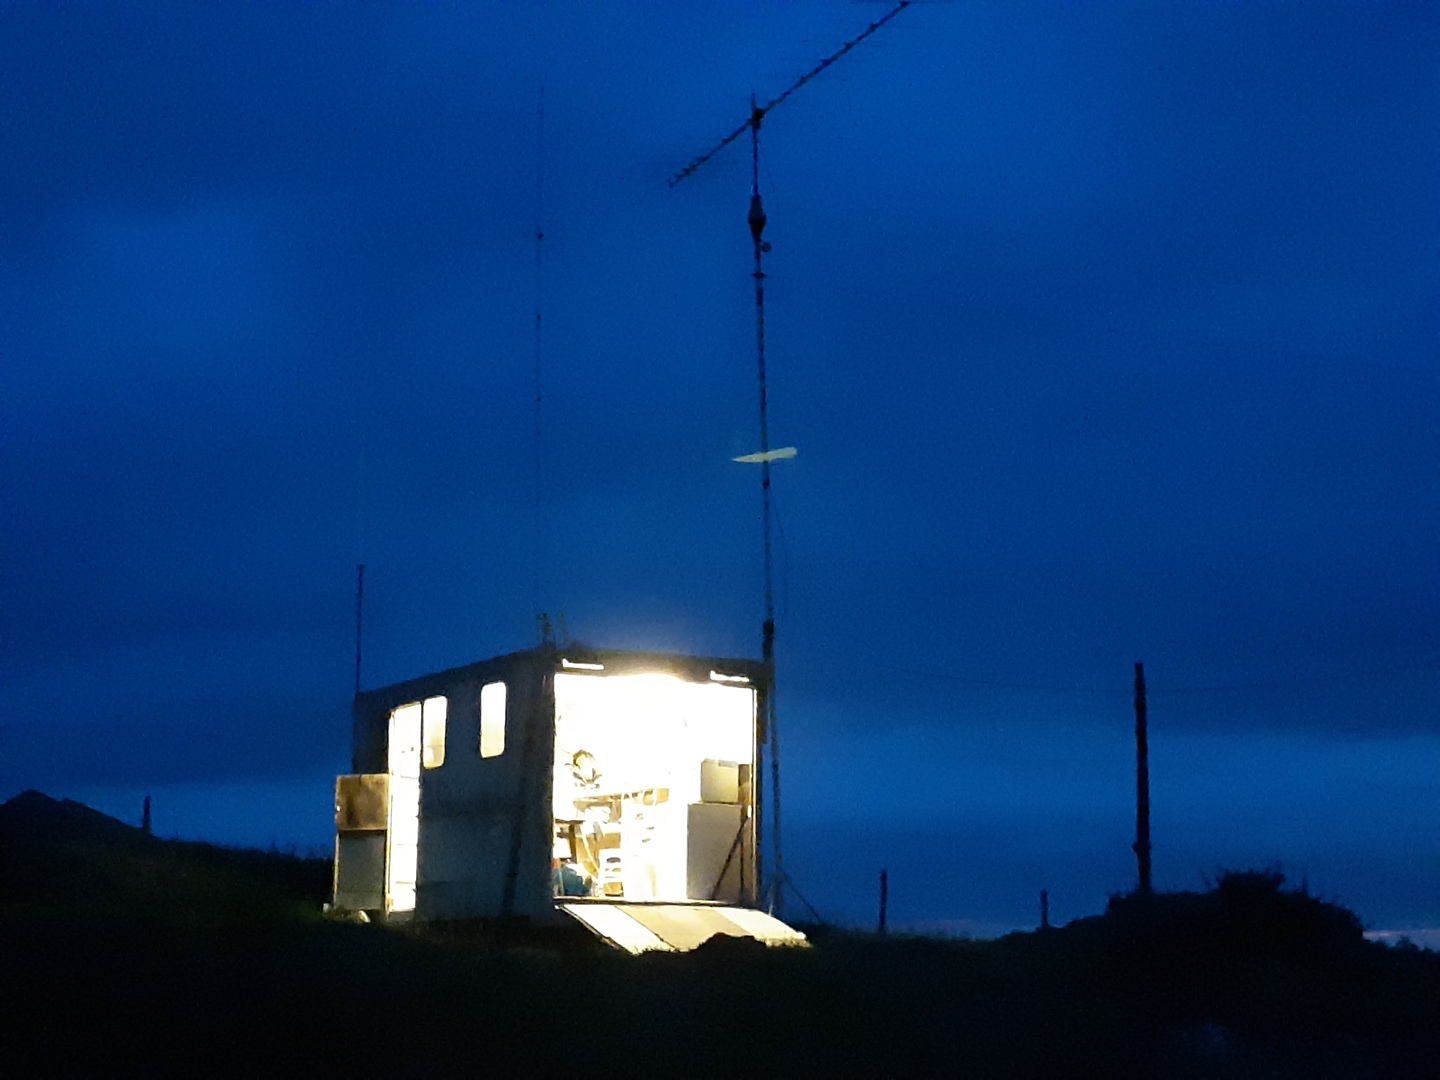
Unlike previous years we did not operate late into the night. Although the 6m contest window is 14:00 UTC – 22:00 UTC we made our last 6m QSO at 21:05 UTC. The last 2m QSO of the Saturday operation was logged at 20:22 UTC.
Normally we would have taken advantage of the early stop on 2m to go for an early start on Sunday morning after the mandatory shutdown. This year was to be a departure as Andy G7KNA had to complete the build of the 28MHz – 70MHz transverter which was to enable our 4m operation on Sunday. An early start in the workshop with one or two snags got the kit to site around 10:00 local time but a couple of problems with the untested transverter meant that Paul 2E0GHT didn’t get on air until 11:00 local time. The faults with the transverter kit were all down to the construction and should not reflect on the design or manufacture of the equipment.
The equipment will be familiar to many being the Ukrainian kit sold by Serge UT5JCW through E-Bay and his own website. Once the initial problem had been ironed out everything worked flawlessly, the problem was a simple one; the transverter board had been positioned too close to the front panel and one of the solder tags on the on-off switch made contact with the shield of an inductor resulting in a short circuit that tripped the power supply’s short circuit protection. A small adjustment with pliers and some insulation tape resolved the problem and everything worked fine.
We had a few interference problems that had not been obvious on the Saturday when 2m/6m was operational. Obviously 2m/4m have a harmonic relationship and when the antennas crossed over the 4m transmissions could be heard on 2m on some frequencies whilst the 4m station would hear "hash" when the 2m station was transmitting.
Some combinations of operating frequencies were worse than others and if the beams weren’t beaming over each other the problem was much reduced. It wasn’t debilitating with a bit of co-operation and in future use of this site greater separation of the beams would probably help.
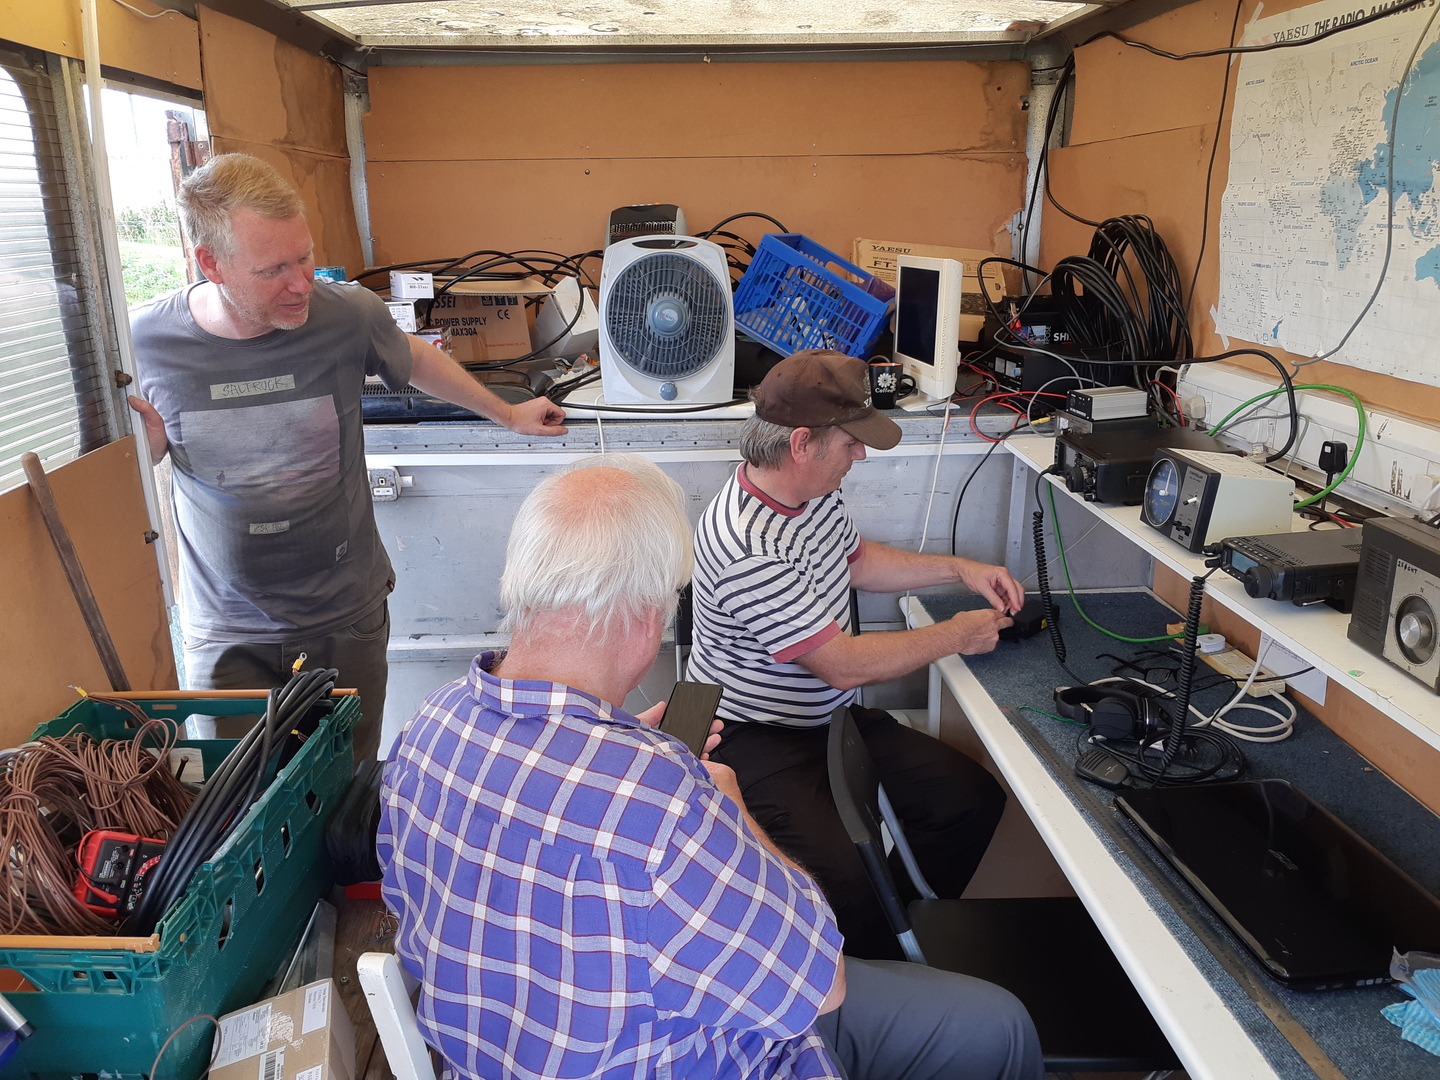
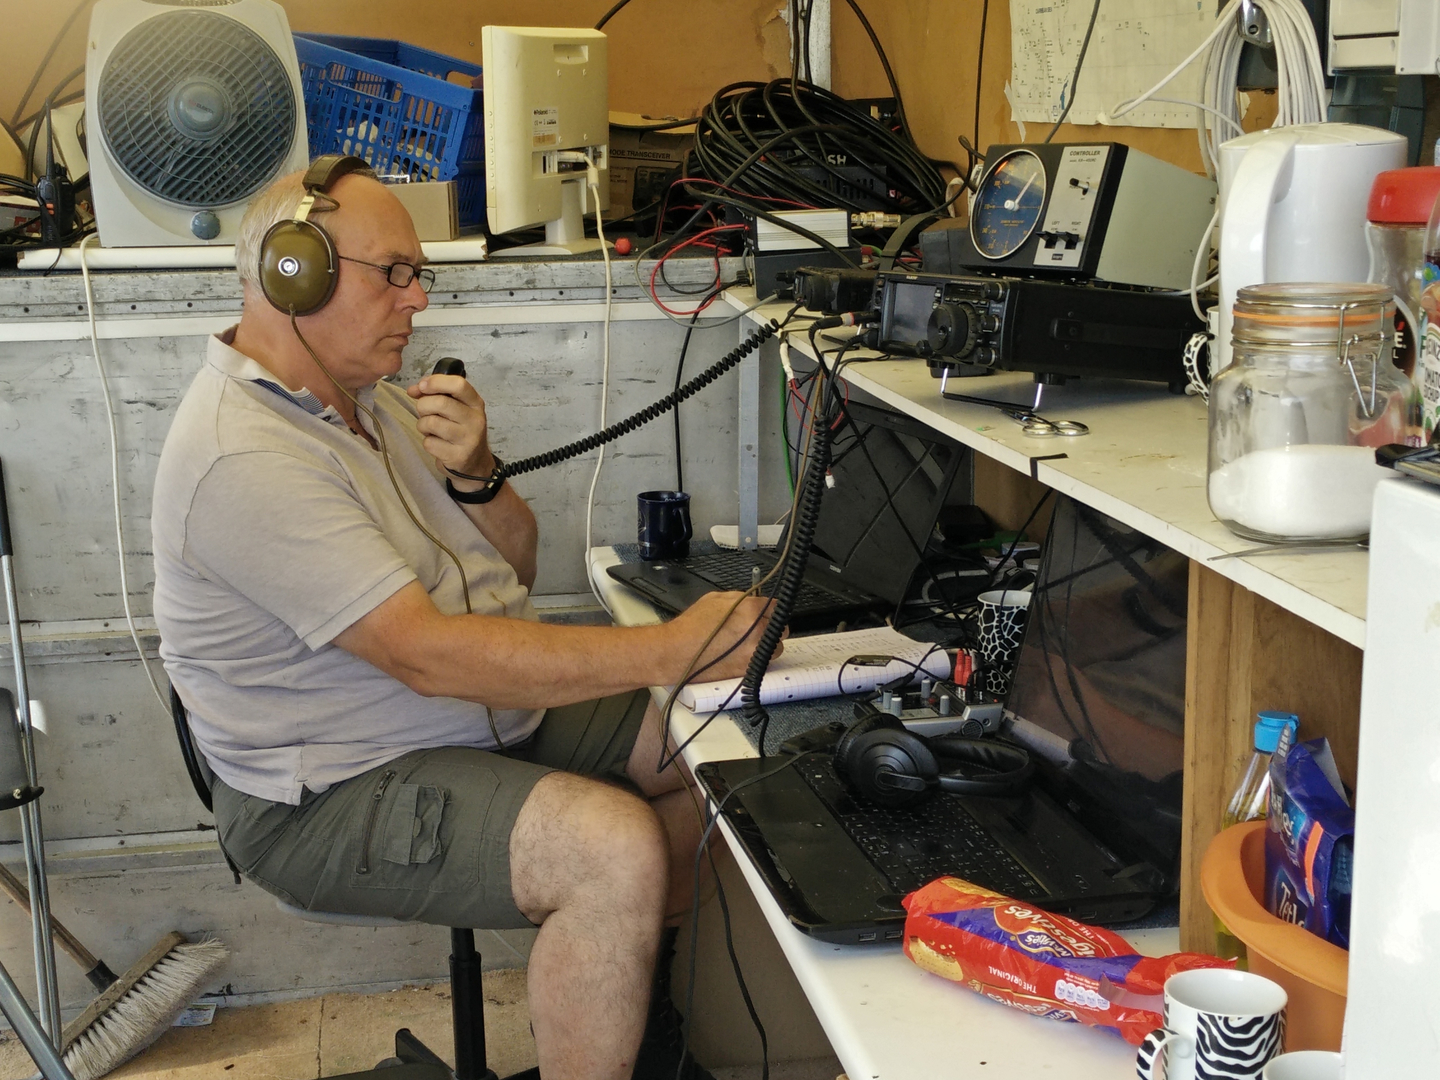
The shortened 4m operation restricted the number of contacts made and of course parts of Europe don’t have a 4m allocation which limits the possible destinations. Overall we had a good weekend but felt that the 2m band was flatter than in recent years and whilst direct comparisons with previous years on 6m are not possible the general feeling was that this, too, was quite flat.
6m Results
The results presented below have been determined following analysis of the unadjudicated log, and will not be updated once results are known.
Number of QSOs
Table 1, below, presents the disposition of QSOs across the operating period and calculates both the average QSO/Hour and by how much each hour deviates from the average. This table when tracked over a number of years can provide an insight into the best times to operate.
Table 1 – QSOs Recorded (6m)
| Day | Time (UTC) | Hour | QSOs | %age of QSOs | Deviation from Average QSOs/Hour | Cumulative QSOs | Cumulative %age of QSOs | Cumulative QSOs/Hour |
|---|---|---|---|---|---|---|---|---|
| S a t u r d a y |
14:00 – 15:00 | 1 | 21 | 33.87% | 170.97% | 21 | 33.87% | 21.00 |
| 15:00 – 16:00 | 2 | 11 | 17.74% | 41.94% | 32 | 51.61% | 16.00 | |
| 16:00 – 17:00 | 3 | 7 | 11.29% | -9.68% | 39 | 62.90% | 13.00 | |
| 17:00 – 18:00 | 4 | 2 | 3.23% | -74.19% | 41 | 66.13% | 10.25 | |
| 18:00 – 19:00 | 5 | 10 | 16.13% | 29.03% | 51 | 82.26% | 10.20 | |
| 19:00 – 20:00 | 6 | 7 | 11.29% | -9.68% | 58 | 93.55% | 9.67 | |
| 20:00 – 21:00 | 7 | 2 | 3.23% | -74.19% | 60 | 96.77% | 8.57 | |
| 21:00 – 22:00 | 8 | 2 | 3.23% | -74.19% | 62 | 100.00% | 7.75 | |
| 22:00 – 23:00 | Shutdown | 0 | 0.00% | -100.00% | 62 | 100.00% | 7.75 | |
| 23:00 – 00:00 | Shutdown | 0 | 0.00% | -100.00% | 62 | 100.00% | 7.75 | |
| S u n d a y |
00:00 – 01:00 | Shutdown | 0 | 0.00% | -100.00% | 62 | 100.00% | 7.75 |
| 01:00 – 02:00 | Shutdown | 0 | 0.00% | -100.00% | 62 | 100.00% | 7.75 | |
| 02:00 – 03:00 | Shutdown | 0 | 0.00% | -100.00% | 62 | 100.00% | 7.75 | |
| 03:00 – 04:00 | Shutdown | 0 | 0.00% | -100.00% | 62 | 100.00% | 7.75 | |
| 04:00 – 05:00 | Shutdown | 0 | 0.00% | -100.00% | 62 | 100.00% | 7.75 | |
| 05:00 – 06:00 | Shutdown | 0 | 0.00% | -100.00% | 62 | 100.00% | 7.75 | |
| 06:00 – 07:00 | Shutdown | 0 | 0.00% | -100.00% | 62 | 100.00% | 7.75 | |
| 07:00 – 08:00 | Shutdown | 0 | 0.00% | -100.00% | 62 | 100.00% | 7.75 | |
| 08:00 – 09:00 | Shutdown | 0 | 0.00% | -100.00% | 62 | 100.00% | 7.75 | |
| 09:00 – 10:00 | Shutdown | 0 | 0.00% | -100.00% | 62 | 100.00% | 7.75 | |
| 10:00 – 11:00 | Shutdown | 0 | 0.00% | -100.00% | 62 | 100.00% | 7.75 | |
| 11:00 – 12:00 | Shutdown | 0 | 0.00% | -100.00% | 62 | 100.00% | 7.75 | |
| 12:00 – 13:00 | Shutdown | 0 | 0.00% | -100.00% | 62 | 100.00% | 7.75 | |
| 13:00 – 14:00 | Shutdown | 0 | 0.00% | -100.00% | 62 | 100.00% | 7.75 | |
| TOTALS | 62 | 100.00% | ||||||
The 6m QSOs followed closely the 2m pattern, in fact it became a bit of a competition within the contest to see which of the two operations could make the most QSOs. Half of all contacts were made in the first couple of hours of operations which given the shorter operating window is not surprising.
Points Scored
Table 2, below, presents the disposition of points scored across the operating period and calculates both the average points/QSO and by how much each hour deviates from the average. This table when read in conjunction with the QSO rate above can provide an insight into the best times to operate, as it is not always the most frenetic periods that yield the best distances.
Table 2 – Points Scored (6m)
| Day | Time (UTC) | Hour | Points | Average Points/QSO | %age of Total Points | Deviation From Average Points/QSO | Cumulative Points | Cumulative Percentage of Points |
|---|---|---|---|---|---|---|---|---|
| S a t u r d a y |
14:00 – 15:00 | 1 | 2996 | 142.67 | 34.68% | 2.40% | 2996 | 34.68% |
| 15:00 – 16:00 | 2 | 1316 | 119.64 | 15.24% | -14.13% | 4312 | 49.92% | |
| 16:00 – 17:00 | 3 | 813 | 116.14 | 9.41% | -16.64% | 5125 | 59.33% | |
| 17:00 – 18:00 | 4 | 73 | 36.50 | 0.85% | -73.80% | 5198 | 60.18% | |
| 18:00 – 19:00 | 5 | 1746 | 174.60 | 20.21% | 25.32% | 6944 | 80.39% | |
| 19:00 – 20:00 | 6 | 1203 | 171.86 | 13.93% | 23.35% | 8147 | 94.32% | |
| 20:00 – 21:00 | 7 | 379 | 189.50 | 4.39% | 36.02% | 8526 | 98.70% | |
| 21:00 – 22:00 | 8 | 112 | 56.00 | 1.30% | -59.81% | 8638 | 100.00% | |
| 22:00 – 23:00 | Shutdown | 0 | 0.00 | 0.00% | -100.00% | 8638 | 100.00% | |
| 23:00 – 00:00 | Shutdown | 0 | 0.00 | 0.00% | -100.00% | 8638 | 100.00% | |
| S u n d a y |
00:00 – 01:00 | Shutdown | 0 | 0.00 | 0.00% | -100.00% | 8638 | 100.00% |
| 01:00 – 02:00 | Shutdown | 0 | 0.00 | 0.00% | -100.00% | 8638 | 100.00% | |
| 02:00 – 03:00 | Shutdown | 0 | 0.00 | 0.00% | -100.00% | 8638 | 100.00% | |
| 03:00 – 04:00 | Shutdown | 0 | 0.00 | 0.00% | -100.00% | 8638 | 100.00% | |
| 04:00 – 05:00 | Shutdown | 0 | 0.00 | 0.00% | -100.00% | 8638 | 100.00% | |
| 05:00 – 06:00 | Shutdown | 0 | 0.00 | 0.00% | -100.00% | 8638 | 100.00% | |
| 06:00 – 07:00 | Shutdown | 0 | 0.00 | 0.00% | -100.00% | 8638 | 100.00% | |
| 07:00 – 08:00 | Shutdown | 0 | 0.00 | 0.00% | -100.00% | 8638 | 100.00% | |
| 08:00 – 09:00 | Shutdown | 0 | 0.00 | 0.00% | -100.00% | 8638 | 100.00% | |
| 09:00 – 10:00 | Shutdown | 0 | 0.00 | 0.00% | -100.00% | 8638 | 100.00% | |
| 10:00 – 11:00 | Shutdown | 0 | 0.00 | 0.00% | -100.00% | 8638 | 100.00% | |
| 11:00 – 12:00 | Shutdown | 0 | 0.00 | 0.00% | -100.00% | 8638 | 100.00% | |
| 12:00 – 13:00 | Shutdown | 0 | 0.00 | 0.00% | -100.00% | 8638 | 100.00% | |
| 13:00 – 14:00 | Shutdown | 0 | 0.00 | 0.00% | -100.00% | 8638 | 100.00% | |
| TOTALS | 8638 | 139.32 | 100.00% | |||||
The points scored tracks quite closely the QSO rate. The first 2 hours accounted for just under 52% of the QSOs and produced 50% of the total points, this differs from what has been seen historically on 2m where quite often later periods in the contest with a lower number of QSOs allow a much higher proportion of the total points to be scored.
Distances Worked
Tables 3 and 4, below, present a summary of the distances worked. The best DX on 6m was MM0CCC/P at 483km
Table 3 – Distances Worked (6m)
| Distance | Number of Stations Worked | Percentage of Stations Worked |
|---|---|---|
| Dist ≤ 1km | 1 | 1.61% |
| 1km < Dist ≤ 5km | 1 | 1.61% |
| 5km < Dist ≤ 10km | 0 | 0.00% |
| 10km < Dist ≤ 20km | 3 | 4.84% |
| 20km < Dist ≤ 50km | 4 | 6.45% |
| 50km < Dist ≤ 100km | 17 | 27.42% |
| 100km < Dist ≤ 200km | 20 | 32.26% |
| 200km < Dist ≤ 350km | 14 | 22.58% |
| 350km < Dist ≤ 500km | 2 | 3.23% |
| 500km < Dist ≤ 750km | 0 | 0.00% |
| 750km < Dist ≤ 1000km | 0 | 0.00% |
| 1000km < Dist ≤ 1500km | 0 | 0.00% |
| 1500km < Dist ≤ 2000km | 0 | 0.00% |
| 2000km < Dist | 0 | 0.00% |
| TOTALS | 62 | 100.00% |
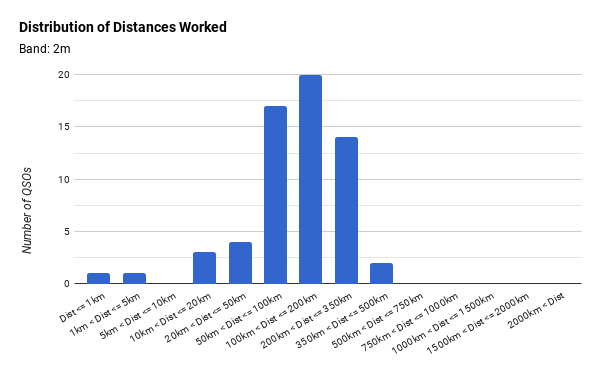
Table 4 – Statistical Analysis of Distances Worked (6m)
| Quantity | Value | Population |
|---|---|---|
| Mean Distance (km) | 139 | |
| Median Distance (km) | 116 | |
| Mode (km) | 67 | 2 |
| 1 Standard Deviation | 98.14 | 70.97% |
| 2 Standard Deviation | 196.28 | 96.77% |
| 3 Standard Deviation | 294.42 | 98.39% |
The distribution of distances is obviously skewed but if the handful of very short distance QSOs are discounted the distribution becomes more "normal".
Countries Worked
The tables below show the number of stations from each country with a specific breakdown for UK stations. The tables are generic allowing flexibility in the website code rather than aspirational in terms of the countries we expect to contact.
Table 5A – UK Stations Worked (6m)
| Country | Callsign Groups | Number of Stations Worked | Percentage of Total QSO |
|---|---|---|---|
| England | G, GX, 2E, M, MX | 53 | 85.48% |
| Special Events | GB | 0 | 0.00% |
| Isle of Man | GD, GT, 2D, MD, MT | 0 | 0.00% |
| Northern Irelend | GI, GN, 2I, MI, MN | 0 | 0.00% |
| Jersey | GJ, GH, 2J, MJ, MH | 0 | 0.00% |
| Scotland | GM, GS, 2M, MM, MS | 1 | 1.61% |
| Gurnsey | GU, GP, 2U, MU, MP | 1 | 1.61% |
| RSGB 2013 Centenary Stations | GV, 2V, MV | 0 | 0.00% |
| Wales | GW, GC, 2W, MW, MC | 4 | 6.45% |
| Club Stations (included above) | GX, MX, GT, MT, GN, MN, GH, MH, GS, MS, GP, MP, GC, MC | 0 | 0.00% |
| SUB-TOTAL | United Kingdom Stations | 59 | 95.16% |
Table 5B – Non UK Stations Worked (6m)
| Country | Callsign Groups | Number of Stations Worked | Percentage of Total QSO |
|---|---|---|---|
| Andorra | C3 | 0 | 0.00% |
| Austria | OE | 0 | 0.00% |
| Belgium | ON, OO, OP, OQ, OR, OS, OT | 1 | 1.61% |
| Cyprus | 5B, C4 | 0 | 0.00% |
| Czech Republic | OK, OL | 0 | 0.00% |
| Denmark | 5P, OZ | 0 | 0.00% |
| Eire | EI, EJ | 1 | 1.61% |
| France (inc Overseas Territories) | F, TM, TO, TX | 1 | 1.61% |
| Germany | DA, DB, DC, DD, DF, DG, DH, DJ, DK, DL, DP, DR | 0 | 0.00% |
| Gibralter | ZB, ZG | 0 | 0.00% |
| Greece | J4, SV | 0 | 0.00% |
| Hungary | HA, HG | 0 | 0.00% |
| Italy | I, IA, IB, IC, ID, IE, IF, IG, IH, IK, IL, IN, IP, IR, IT, IV, IW, IX | 0 | 0.00% |
| Liechtenstein | HB0 | 0 | 0.00% |
| Luxembourg | LX | 0 | 0.00% |
| Monaco | 3A | 0 | 0.00% |
| Netherlands (inc Antilles) | PA, PB, PD, PE, PI, PJ | 0 | 0.00% |
| Norway | LA, LB, LC, LG, LI, LJ, LN | 0 | 0.00% |
| Poland | HF, SN, SO, SP, SQ, SR | 0 | 0.00% |
| Portugul (inc Azores) | CT, CU | 0 | 0.00% |
| San Marino | T7 | 0 | 0.00% |
| Sardinia | IM, IS | 0 | 0.00% |
| Slovak Republic | OM | 0 | 0.00% |
| Slovenia | 7S | 0 | 0.00% |
| Spain (inc Overseas Islands, Territories, Balearic Islands, Canary Islands, Ceuta and Melilla) | AM, AN, AO, EA, EB, EC, ED, EF, EG, EH | 0 | 0.00% |
| Sweden | 8S, S5, SH, SI, SJ, SL, SM | 0 | 0.00% |
| Switzerland | HB, HE | 0 | 0.00% |
| Vatican City | HV | 0 | 0.00% |
| SUB-TOTAL | Non United Kingdom Stations | 3 | 4.84% |
Table 5C – Summary of Stations Worked (6m)
| Country | Callsign Groups | Number of Stations Worked | Percentage of Total QSO |
|---|---|---|---|
| SUB-TOTAL | United Kingdom Stations | 59 | 95.16% |
| SUB-TOTAL | Non United Kingdom Stations | 3 | 4.84% |
| TOTAL MATCHED | All UK and Non UK Stations | 62 | 100.00% |
| Unmatched Callsigns | Possible Log Errors or Foreign Special Event or similar Stations | 0 | 0.00% |
| FINAL TOTAL | All Stations inc Unmatched Callsigns | 62 | 100.00% |
There is little doubt that the band conditions were flat, comparisons with previous years are, obviously, not possible in the case of 6m since we haven’t entertained a 6m operation for many years. To have only 5% of QSOs outside of the UK was less than expected.
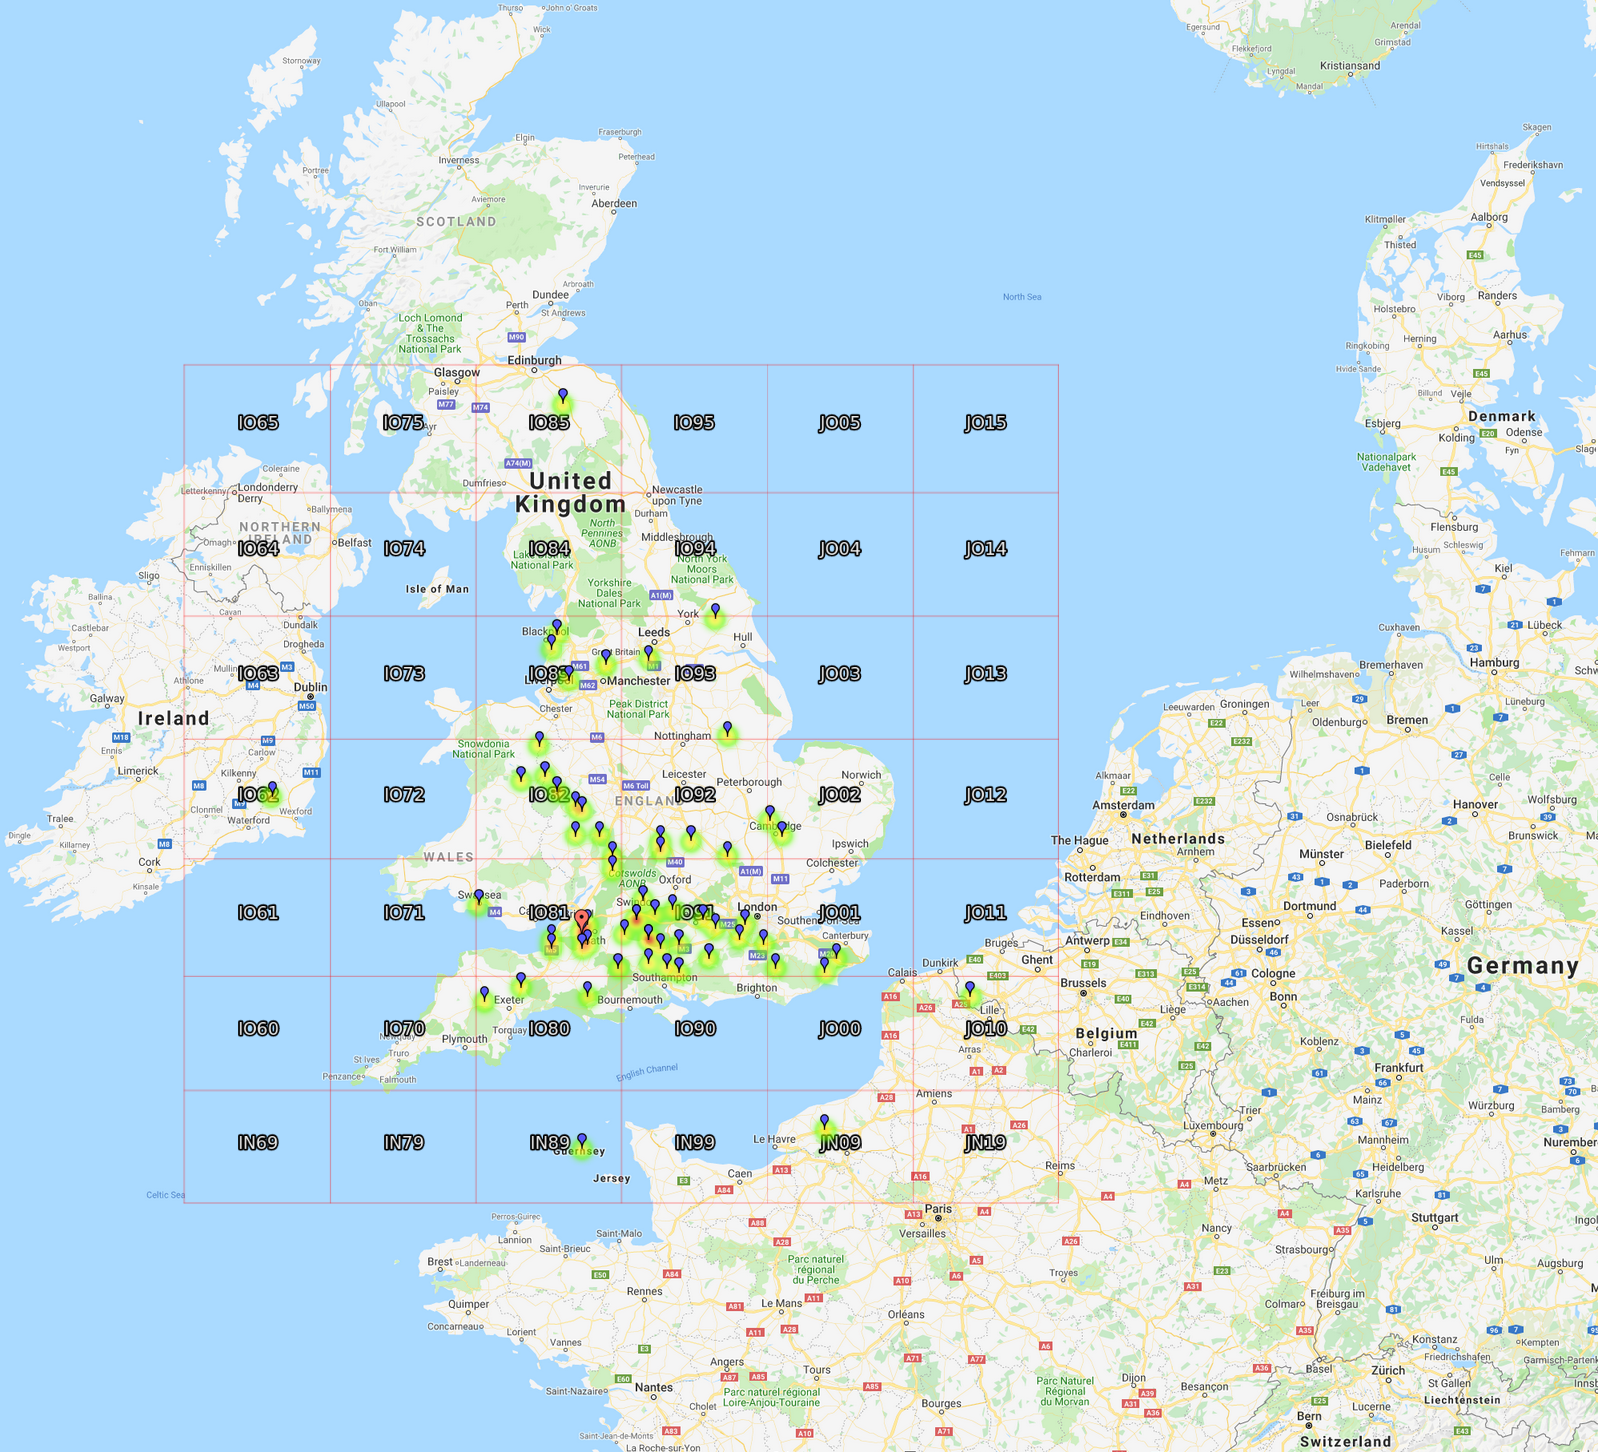
Location of Stations Worked on 6m
Submitted Log
Below is the full log submitted following participation in this years event. If any information is received post submission updates will appear in the “Notes” column.
We normally get round to uploading our Field Day contest logs to eQSL.cc, but otherwise do not exchange QSL cards in this event. If you wish to QSL traditionally please send information via the RSGB Bureau.
VHF National Field Day 2019 – (6m Band) Log
| Date (UTC) | Time (UTC) | Station Worked | Band | Mode | Sent | Received | Locator | Distance (km) |
Notes | Points | ||
|---|---|---|---|---|---|---|---|---|---|---|---|---|
| RST | Serial | RST | Serial | |||||||||
| 06/07/19 | 14:04 | G4ILJ | 6m | SSB | 59 | 001 | 59 | 004 | IO91th | 151 | 151 | |
| 06/07/19 | 14:05 | M0IEP | 6m | SSB | 59 | 002 | 59 | 001 | IO91dp | 67 | 67 | |
| 06/07/19 | 14:12 | G2XV/P | 6m | SSB | 59 | 003 | 55 | 006 | JO02ah | 208 | 208 | |
| 06/07/19 | 14:13 | G3TCR/P | 6m | SSB | 59 | 004 | 59 | 004 | IO91jg | 94 | 94 | |
| 06/07/19 | 14:14 | G8NDN | 6m | SSB | 59 | 005 | 59 | 004 | IO91gf | 77 | 77 | |
| 06/07/19 | 14:16 | G0FBB/P | 6m | SSB | 59 | 006 | 59 | 011 | JO01ld | 245 | 245 | |
| 06/07/19 | 14:18 | G3PIA/P | 6m | SSB | 59 | 007 | 59 | 010 | IO91in | 90 | 90 | |
| 06/07/19 | 14:20 | M0MSZ | 6m | SSB | 59 | 008 | 59 | 002 | IO91ai | 41 | 41 | |
| 06/07/19 | 14:20 | G4FJK | 6m | SSB | 59 | 009 | 59 | 010 | IO80hv | 78 | 78 | |
| 06/07/19 | 14:23 | G4BXM | 6m | SSB | 59 | 010 | 58 | 004 | IO91uk | 157 | 157 | |
| 06/07/19 | 14:25 | G3VEF/P | 6m | SSB | 59 | 011 | 55 | 003 | IO91ja | 101 | 101 | |
| 06/07/19 | 14:29 | G4CXQ | 6m | SSB | 59 | 012 | 59 | 006 | IO81mh | 30 | ERROR: Correct callsign G4CXQ/P | 0 |
| 06/07/19 | 14:33 | GW3SRT/P | 6m | SSB | 59 | 013 | 59 | 007 | IO82lq | 153 | 153 | |
| 06/07/19 | 14:35 | G3NYY | 6m | SSB | 59 | 014 | 58 | 004 | IO82wa | 80 | 80 | |
| 06/07/19 | 14:36 | G4ATH/P | 6m | SSB | 59 | 015 | 59 | 012 | IO83nu | 279 | 279 | |
| 06/07/19 | 14:38 | G4IFX | 6m | SSB | 59 | 016 | 59 | 008 | IO91od | 124 | 124 | |
| 06/07/19 | 14:40 | G4HGI | 6m | SSB | 59 | 017 | 58 | 015 | IO83pl | 237 | 237 | |
| 06/07/19 | 14:43 | G7RHF | 6m | SSB | 59 | 018 | 56 | 007 | IO82qk | 121 | 121 | |
| 06/07/19 | 14:49 | M5MK/P | 6m | SSB | 59 | 019 | 59 | 020 | IO92ra | 157 | 157 | |
| 06/07/19 | 14:50 | ON8DM | 6m | SSB | 59 | 020 | 59 | 016 | JO10jt | 378 | 378 | |
| 06/07/19 | 14:52 | G4DDL | 6m | SSB | 59 | 021 | 58 | 002 | IO91pj | 128 | 128 | |
| 06/07/19 | 15:02 | G3TBK/P | 6m | SSB | 59 | 022 | 59 | 025 | IO93ra | 231 | 231 | |
| 06/07/19 | 15:04 | G3ZME/P | 6m | SSB | 59 | 023 | 59 | 032 | IO82nn | 137 | 137 | |
| 06/07/19 | 15:14 | G4ALE/P | 6m | SSB | 59 | 024 | 59 | 036 | IO91xg | 175 | 175 | |
| 06/07/19 | 15:17 | G3IOI | 6m | SSB | 59 | 025 | 59 | 001 | IO81rj | 5 | 5 | |
| 06/07/19 | 15:23 | G3XBI | 6m | SSB | 59 | 026 | 59 | 002 | IO81mf | 33 | 33 | |
| 06/07/19 | 15:35 | GU4CHY | 6m | SSB | 59 | 027 | 57 | 003 | IN89rl | 209 | 209 | |
| 06/07/19 | 15:37 | G8BFV | 6m | SSB | 59 | 028 | 59 | 002 | IO82qe | 93 | ERROR: Correct Locator IO81QE | 0 |
| 06/07/19 | 15:40 | G8SRC/P | 6m | SSB | 59 | 029 | 59 | 055 | IO91cl | 54 | 54 | |
| 06/07/19 | 15:44 | G0IVR/P | 6m | SSB | 54 | 030 | 55 | 017 | IO91hb | 88 | 88 | |
| 06/07/19 | 15:46 | G8LED/P | 6m | SSB | 56 | 031 | 57 | 029 | IO92ld | 136 | 136 | |
| 06/07/19 | 15:47 | GW4SHF | 6m | SSB | 59 | 032 | 56 | 038 | IO82hp | 155 | 155 | |
| 06/07/19 | 16:00 | G1TPA/P | 6m | SSB | 59 | 033 | 59 | 033 | JO01bb | 189 | 189 | |
| 06/07/19 | 16:19 | G3PYE/P | 6m | SSB | 59 | 034 | 59 | 061 | JO02ce | 211 | 211 | |
| 06/07/19 | 16:21 | G7RSO | 6m | SSB | 59 | 035 | 57 | 003 | IO91ec | 70 | 70 | |
| 06/07/19 | 16:45 | M1CJE | 6m | SSB | 59 | 036 | 59 | 004 | IO91cl | 54 | ERROR: Correct Locator IO91CJ | 0 |
| 06/07/19 | 16:46 | M0BEW | 6m | SSB | 59 | 037 | 59 | 023 | IO82rj | 116 | 116 | |
| 06/07/19 | 16:48 | G2LO/P | 6m | SSB | 59 | 038 | 57 | 082 | IO92gb | 109 | 109 | |
| 06/07/19 | 16:51 | G0ARC/P | 6m | SSB | 59 | 039 | 59 | 034 | IO91eh | 64 | ERROR: Correct RST 56. REVERSE ERROR: Logged sent RST 57 | 0 |
| 06/07/19 | 17:08 | G6SIX | 6m | SSB | 59 | 040 | 55 | 016 | IO91fm | 72 | ERROR: Broken callsign adjudicated invalid | 0 |
| 06/07/19 | 17:54 | G3TKF | 6m | SSB | 59 | 041 | 59 | 005 | IO81ri | 1 | 1 | |
| 06/07/19 | 18:05 | GW4AYJ | 6m | SSB | 59 | 042 | 59 | 001 | IO81ao | 102 | 102 | |
| 06/07/19 | 18:18 | G7FBD | 6m | SSB | 59 | 043 | 58 | 002 | IO81sk | 11 | 11 | |
| 06/07/19 | 18:19 | G8NXJ | 6m | SSB | 59 | 044 | 59 | 005 | IO91nl | 117 | 117 | |
| 06/07/19 | 18:23 | F4HJO | 6m | SSB | 59 | 045 | 57 | 016 | JN09jp | 303 | 303 | |
| 06/07/19 | 18:28 | G2BQY/P | 6m | SSB | 59 | 046 | 59 | 135 | IO81rf | 14 | 14 | |
| 06/07/19 | 18:30 | G4RFR/P | 6m | SSB | 59 | 047 | 59 | 084 | IO80st | 61 | 61 | |
| 06/07/19 | 18:44 | EI9E/P | 6m | SSB | 59 | 048 | 59 | 126 | IO62om | 319 | 319 | |
| 06/07/19 | 18:49 | M0HRF/P | 6m | SSB | 59 | 049 | 59 | 073 | JO01ja | 236 | 236 | |
| 06/07/19 | 18:54 | G0OLE/P | 6m | SSB | 59 | 050 | 59 | 046 | IO93px | 317 | 317 | |
| 06/07/19 | 18:59 | G8ONK | 6m | SSB | 59 | 051 | 52 | 021 | IO83mr | 266 | 266 | |
| 06/07/19 | 19:03 | MM0CCC/P | 6m | SSB | 59 | 052 | 57 | 051 | IO85oq | 483 | 483 | |
| 06/07/19 | 19:12 | G3TQZ | 6m | SSB | 59 | 053 | 59 | 009 | IO82ue | 95 | 95 | |
| 06/07/19 | 19:19 | G3RLE | 6m | SSB | 59 | 054 | 59 | 015 | IO83vo | 252 | 252 | |
| 06/07/19 | 19:20 | G4RRA | 6m | SSB | 59 | 055 | 59 | 025 | IO80bs | 114 | 114 | |
| 06/07/19 | 19:24 | G8NT | 6m | SSB | 59 | 056 | 59 | 004 | IO81sg | 11 | 11 | |
| 06/07/19 | 19:26 | GW3ZTT/P | 6m | SSB | 59 | 057 | 59 | 099 | IO82kw | 181 | 181 | |
| 06/07/19 | 19:50 | G0LGS | 6m | SSB | 59 | 058 | 59 | 009 | IO81wv | 67 | 67 | |
| 06/07/19 | 20:06 | G3RCW/P | 6m | SSB | 56 | 059 | 56 | 079 | IO93ep | 263 | REVERSE ERROR: Logged callsign GW4WAW/P | 263 |
| 06/07/19 | 20:31 | G3VLG/P | 6m | SSB | 57 | 060 | 57 | 042 | IO92gd | 116 | 116 | |
| 06/07/19 | 21:04 | G6AHY | 6m | SSB | 59 | 061 | 58 | 005 | IO91eh | 64 | 64 | |
| 06/07/19 | 21:05 | G8DER | 6m | SSB | 59 | 062 | 59 | 010 | IO81xb | 48 | 48 | |
| TOTALS | 62 | 8638 | 5 Contact(s) lost due to Log Errors | 8325 | ||||||||
| Best DX (Pre-Adjudication) | MM0CCC/P | 483km | Error Rate = 8.06% | -3.62% | ||||||||
| Best DX (Post-Adjudication) | MM0CCC/P | 483km | ||||||||||
Our error rate of 8.06% in terms of the number of contacts with errors only resulted in the loss of 3.62% of our claimed score. The errors are random and only affect 5 QSOs. The error rate for the Low Power 50MHz class was only 4.04% so we clearly have some way to go in our accuracy.
Submitted Logs 6m
The closing date for log submission was 13/07/2019. By this time some 62 individuals and organisations had submitted logs in the various classes on 6m. Comparing those who took part with our log reveals:
Table 6 – Participating Stations Worked on 6m
| Class | Number of Submitted Logs | Worked | |
|---|---|---|---|
| Number | Percentage | ||
| Open (O) | 13 | 10 | 76.92% |
| Restricted (R) | 20 | 13 | 65.00% |
| Low Power (L) | 2 | 1 | 50.00% |
| Single Transmitter (MS) | 4 | 3 | 75.00% |
| Fixed Station Sweepers: Open (FSO) | 5 | 1 | 20.00% |
| Fixed Station Sweepers: Restricted (FSR) | 18 | 6 | 33.33% |
| Checklogs | 0 | 0 | 0.00% |
| TOTAL | 62 | 34 | 54.84% |
The headline analysis of this information is as follows:
- We worked 34 or 55% of the stations taking part or submitting checklogs
- 28 or 45% of the stations we worked did not submit a log
- Our best proportion worked was the Open (O) category where we worked 77% of the participating stations
- Our lowest proportion worked was the Checklogs category where we worked 0% of the participating stations
Some of the participating or checklog stations submitted logs with relatively few contacts in them. On this occasion 8 stations (13%) submitted logs with less than 9 contacts. These stations may have only been operational for a short period of time and therefore the probability of running across them or of them running across us is reduced.
We worked 1 of these sub 9 QSO operations.
Table 7 – Participating Stations with 9 or More QSOs Worked on 6m
| Class | Number of Submitted Logs | Worked | |
|---|---|---|---|
| Number | Percentage | ||
| Open (O) | 13 | 10 | 76.92% |
| Restricted (R) | 20 | 13 | 65.00% |
| Low Power (L) | 1 | 1 | 100.00% |
| Single Transmitter (MS) | 4 | 3 | 75.00% |
| Fixed Station Sweepers: Open (FSO) | 4 | 1 | 25.00% |
| Fixed Station Sweepers: Restricted (FSR) | 12 | 5 | 41.67% |
| Checklogs | 0 | 0 | 0.00% |
| TOTAL | 54 | 33 | 61.11% |
Ignoring our 1 contacts and the 8 sub 9 QSO operations our "hit rate" becomes 33 out of 54 or 61%.
Results
Results Section L 6m
| Group | Callsign | Locator | QSOs | Score | Best DX | Points/QSO | ||
|---|---|---|---|---|---|---|---|---|
| Actual | Normalised | Station | km | |||||
| South Bristol ARC | G4WAW/P | IO81RI | 57 | 8325 | 1000 | MM0CCC/P | 483 | 146.05 |
| Fareham & DARC | G3VEF/P | IO91JA | 13 | 1115 | 134 | GW3ZTT/P | 251 | 85.77 |
| Ardiffery VHF Group | GM8ZKU/P | IO97BJ | 2 | 264 | 32 | MM0CCC/P | 199 | 132.00 |
The first time we’ve been top of a single band table.
4m Results
The results presented below have been determined following analysis of the unadjudicated log, and will not be updated once results are known.
Number of QSOs
Table 1, below, presents the disposition of QSOs across the operating period and calculates both the average QSO/Hour and by how much each hour deviates from the average. This table when tracked over a number of years can provide an insight into the best times to operate.
Table 1 – QSOs Recorded (4m)
| Day | Time (UTC) | Hour | QSOs | %age of QSOs | Deviation from Average QSOs/Hour | Cumulative QSOs | Cumulative %age of QSOs | Cumulative QSOs/Hour |
|---|---|---|---|---|---|---|---|---|
| S a t u r d a y |
14:00 – 15:00 | Shutdown | 0 | 0.00% | -100.00% | 0 | 0.00% | 0.00 |
| 15:00 – 16:00 | Shutdown | 0 | 0.00% | -100.00% | 0 | 0.00% | 0.00 | |
| 16:00 – 17:00 | Shutdown | 0 | 0.00% | -100.00% | 0 | 0.00% | 0.00 | |
| 17:00 – 18:00 | Shutdown | 0 | 0.00% | -100.00% | 0 | 0.00% | 0.00 | |
| 18:00 – 19:00 | Shutdown | 0 | 0.00% | -100.00% | 0 | 0.00% | 0.00 | |
| 19:00 – 20:00 | Shutdown | 0 | 0.00% | -100.00% | 0 | 0.00% | 0.00 | |
| 20:00 – 21:00 | Shutdown | 0 | 0.00% | -100.00% | 0 | 0.00% | 0.00 | |
| 21:00 – 22:00 | Shutdown | 0 | 0.00% | -100.00% | 0 | 0.00% | 0.00 | |
| 22:00 – 23:00 | Shutdown | 0 | 0.00% | -100.00% | 0 | 0.00% | 0.00 | |
| 23:00 – 00:00 | Shutdown | 0 | 0.00% | -100.00% | 0 | 0.00% | 0.00 | |
| S u n d a y |
00:00 – 01:00 | Shutdown | 0 | 0.00% | -100.00% | 0 | 0.00% | 0.00 |
| 01:00 – 02:00 | Shutdown | 0 | 0.00% | -100.00% | 0 | 0.00% | 0.00 | |
| 02:00 – 03:00 | Shutdown | 0 | 0.00% | -100.00% | 0 | 0.00% | 0.00 | |
| 03:00 – 04:00 | Shutdown | 0 | 0.00% | -100.00% | 0 | 0.00% | 0.00 | |
| 04:00 – 05:00 | Shutdown | 0 | 0.00% | -100.00% | 0 | 0.00% | 0.00 | |
| 05:00 – 06:00 | Shutdown | 0 | 0.00% | -100.00% | 0 | 0.00% | 0.00 | |
| 06:00 – 07:00 | Shutdown | 0 | 0.00% | -100.00% | 0 | 0.00% | 0.00 | |
| 07:00 – 08:00 | Shutdown | 0 | 0.00% | -100.00% | 0 | 0.00% | 0.00 | |
| 08:00 – 09:00 | Shutdown | 0 | 0.00% | -100.00% | 0 | 0.00% | 0.00 | |
| 09:00 – 10:00 | Shutdown | 0 | 0.00% | -100.00% | 0 | 0.00% | 0.00 | |
| 10:00 – 11:00 | 1 | 7 | 46.67% | 40.00% | 7 | 46.67% | 7.00 | |
| 11:00 – 12:00 | 2 | 5 | 33.33% | 0.00% | 12 | 80.00% | 6.00 | |
| 12:00 – 13:00 | 3 | 3 | 20.00% | -40.00% | 15 | 100.00% | 5.00 | |
| 13:00 – 14:00 | Shutdown | 0 | 0.00% | -100.00% | 15 | 100.00% | 5.00 | |
| TOTALS | 15 | 100.00% | ||||||
The limited number of QSOs made during the contest precludes any definitive conclusions or patterns being reported.
Points Scored
Table 2, below, presents the disposition of points scored across the operating period and calculates both the average points/QSO and by how much each hour deviates from the average. This table when read in conjunction with the QSO rate above can provide an insight into the best times to operate, as it is not always the most frenetic periods that yield the best distances.
Table 2 – Points Scored (4m)
| Day | Time (UTC) | Hour | Points | Average Points/QSO | %age of Total Points | Deviation From Average Points/QSO | Cumulative Points | Cumulative Percentage of Points |
|---|---|---|---|---|---|---|---|---|
| S a t u r d a y |
14:00 – 15:00 | Shutdown | 0 | 0.00 | 0.00% | -100.00% | 0 | 0.00% |
| 15:00 – 16:00 | Shutdown | 0 | 0.00 | 0.00% | -100.00% | 0 | 0.00% | |
| 16:00 – 17:00 | Shutdown | 0 | 0.00 | 0.00% | -100.00% | 0 | 0.00% | |
| 17:00 – 18:00 | Shutdown | 0 | 0.00 | 0.00% | -100.00% | 0 | 0.00% | |
| 18:00 – 19:00 | Shutdown | 0 | 0.00 | 0.00% | -100.00% | 0 | 0.00% | |
| 19:00 – 20:00 | Shutdown | 0 | 0.00 | 0.00% | -100.00% | 0 | 0.00% | |
| 20:00 – 21:00 | Shutdown | 0 | 0.00 | 0.00% | -100.00% | 0 | 0.00% | |
| 21:00 – 22:00 | Shutdown | 0 | 0.00 | 0.00% | -100.00% | 0 | 0.00% | |
| 22:00 – 23:00 | Shutdown | 0 | 0.00 | 0.00% | -100.00% | 0 | 0.00% | |
| 23:00 – 00:00 | Shutdown | 0 | 0.00 | 0.00% | -100.00% | 0 | 0.00% | |
| S u n d a y |
00:00 – 01:00 | Shutdown | 0 | 0.00 | 0.00% | -100.00% | 0 | 0.00% |
| 01:00 – 02:00 | Shutdown | 0 | 0.00 | 0.00% | -100.00% | 0 | 0.00% | |
| 02:00 – 03:00 | Shutdown | 0 | 0.00 | 0.00% | -100.00% | 0 | 0.00% | |
| 03:00 – 04:00 | Shutdown | 0 | 0.00 | 0.00% | -100.00% | 0 | 0.00% | |
| 04:00 – 05:00 | Shutdown | 0 | 0.00 | 0.00% | -100.00% | 0 | 0.00% | |
| 05:00 – 06:00 | Shutdown | 0 | 0.00 | 0.00% | -100.00% | 0 | 0.00% | |
| 06:00 – 07:00 | Shutdown | 0 | 0.00 | 0.00% | -100.00% | 0 | 0.00% | |
| 07:00 – 08:00 | Shutdown | 0 | 0.00 | 0.00% | -100.00% | 0 | 0.00% | |
| 08:00 – 09:00 | Shutdown | 0 | 0.00 | 0.00% | -100.00% | 0 | 0.00% | |
| 09:00 – 10:00 | Shutdown | 0 | 0.00 | 0.00% | -100.00% | 0 | 0.00% | |
| 10:00 – 11:00 | 1 | 655 | 93.57 | 36.80% | -21.15% | 655 | 36.80% | |
| 11:00 – 12:00 | 2 | 474 | 94.80 | 26.63% | -20.11% | 1129 | 63.43% | |
| 12:00 – 13:00 | 3 | 651 | 217.00 | 36.57% | 82.87% | 1780 | 100.00% | |
| 13:00 – 14:00 | Shutdown | 0 | 0.00 | 0.00% | -100.00% | 1780 | 100.00% | |
| TOTALS | 1780 | 118.67 | 100.00% | |||||
The lowest number of QSOs occurred in the third hour of operation but yielded the best score.
Distances Worked
Tables 3 and 4, below, present a summary of the distances worked. The best DX on 4m was GM3HAM/P at 408km
Table 3 – Distances Worked (4m)
| Distance | Number of Stations Worked | Percentage of Stations Worked |
|---|---|---|
| Dist ≤ 1km | 0 | 0.00% |
| 1km < Dist ≤ 5km | 1 | 6.67% |
| 5km < Dist ≤ 10km | 0 | 0.00% |
| 10km < Dist ≤ 20km | 3 | 20.00% |
| 20km < Dist ≤ 50km | 2 | 13.33% |
| 50km < Dist ≤ 100km | 2 | 13.33% |
| 100km < Dist ≤ 200km | 4 | 26.67% |
| 200km < Dist ≤ 350km | 2 | 13.33% |
| 350km < Dist ≤ 500km | 1 | 6.67% |
| 500km < Dist ≤ 750km | 0 | 0.00% |
| 750km < Dist ≤ 1000km | 0 | 0.00% |
| 1000km < Dist ≤ 1500km | 0 | 0.00% |
| 1500km < Dist ≤ 2000km | 0 | 0.00% |
| 2000km < Dist | 0 | 0.00% |
| TOTALS | 15 | 100.00% |
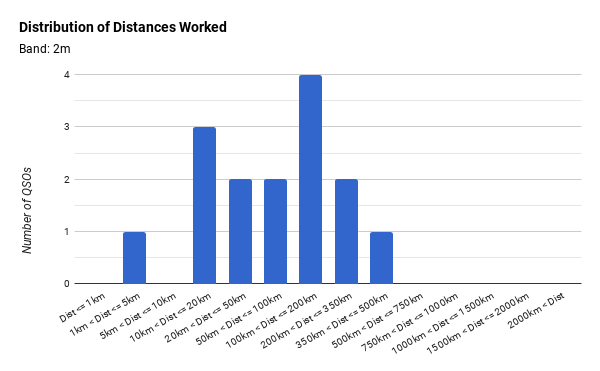
Table 4 – Statistical Analysis of Distances Worked (4m)
| Quantity | Value | Population |
|---|---|---|
| Mean Distance (km) | 119 | |
| Median Distance (km) | 88 | |
| 1 Standard Deviation | 110.72 | 80.00% |
| 2 Standard Deviation | 221.45 | 93.33% |
| 3 Standard Deviation | 332.17 | 100.00% |
The limited number of QSOs makes a distribution model difficult. A normal distribution would be expected but this appears more rectangular.
Countries Worked
The tables below show the number of stations from each country with a specific breakdown for UK stations. The tables are generic allowing flexibility in the website code rather than aspirational in terms of the countries we expect to contact.
Table 5A – UK Stations Worked (4m)
| Country | Callsign Groups | Number of Stations Worked | Percentage of Total QSO |
|---|---|---|---|
| England | G, GX, 2E, M, MX | 12 | 80.00% |
| Special Events | GB | 0 | 0.00% |
| Isle of Man | GD, GT, 2D, MD, MT | 0 | 0.00% |
| Northern Irelend | GI, GN, 2I, MI, MN | 0 | 0.00% |
| Jersey | GJ, GH, 2J, MJ, MH | 0 | 0.00% |
| Scotland | GM, GS, 2M, MM, MS | 1 | 6.67% |
| Gurnsey | GU, GP, 2U, MU, MP | 0 | 0.00% |
| RSGB 2013 Centenary Stations | GV, 2V, MV | 0 | 0.00% |
| Wales | GW, GC, 2W, MW, MC | 2 | 13.33% |
| Club Stations (included above) | GX, MX, GT, MT, GN, MN, GH, MH, GS, MS, GP, MP, GC, MC | 0 | 0.00% |
| SUB-TOTAL | United Kingdom Stations | 15 | 100.00% |
Table 5B – Non UK Stations Worked (4m)
| Country | Callsign Groups | Number of Stations Worked | Percentage of Total QSO |
|---|---|---|---|
| Andorra | C3 | 0 | 0.00% |
| Austria | OE | 0 | 0.00% |
| Belgium | ON, OO, OP, OQ, OR, OS, OT | 0 | 0.00% |
| Cyprus | 5B, C4 | 0 | 0.00% |
| Czech Republic | OK, OL | 0 | 0.00% |
| Denmark | 5P, OZ | 0 | 0.00% |
| Eire | EI, EJ | 0 | 0.00% |
| France (inc Overseas Territories) | F, TM, TO, TX | 0 | 0.00% |
| Germany | DA, DB, DC, DD, DF, DG, DH, DJ, DK, DL, DP, DR | 0 | 0.00% |
| Gibralter | ZB, ZG | 0 | 0.00% |
| Greece | J4, SV | 0 | 0.00% |
| Hungary | HA, HG | 0 | 0.00% |
| Italy | I, IA, IB, IC, ID, IE, IF, IG, IH, IK, IL, IN, IP, IR, IT, IV, IW, IX | 0 | 0.00% |
| Liechtenstein | HB0 | 0 | 0.00% |
| Luxembourg | LX | 0 | 0.00% |
| Monaco | 3A | 0 | 0.00% |
| Netherlands (inc Antilles) | PA, PB, PD, PE, PI, PJ | 0 | 0.00% |
| Norway | LA, LB, LC, LG, LI, LJ, LN | 0 | 0.00% |
| Poland | HF, SN, SO, SP, SQ, SR | 0 | 0.00% |
| Portugul (inc Azores) | CT, CU | 0 | 0.00% |
| San Marino | T7 | 0 | 0.00% |
| Sardinia | IM, IS | 0 | 0.00% |
| Slovak Republic | OM | 0 | 0.00% |
| Slovenia | 7S | 0 | 0.00% |
| Spain (inc Overseas Islands, Territories, Balearic Islands, Canary Islands, Ceuta and Melilla) | AM, AN, AO, EA, EB, EC, ED, EF, EG, EH | 0 | 0.00% |
| Sweden | 8S, S5, SH, SI, SJ, SL, SM | 0 | 0.00% |
| Switzerland | HB, HE | 0 | 0.00% |
| Vatican City | HV | 0 | 0.00% |
| SUB-TOTAL | Non United Kingdom Stations | 0 | 0.00% |
Table 5C – Summary of Stations Worked (4m)
| Country | Callsign Groups | Number of Stations Worked | Percentage of Total QSO |
|---|---|---|---|
| SUB-TOTAL | United Kingdom Stations | 15 | 100.00% |
| SUB-TOTAL | Non United Kingdom Stations | 0 | 0.00% |
| TOTAL MATCHED | All UK and Non UK Stations | 15 | 100.00% |
| Unmatched Callsigns | Possible Log Errors or Foreign Special Event or similar Stations | 0 | 0.00% |
| FINAL TOTAL | All Stations inc Unmatched Callsigns | 15 | 100.00% |
Many Region 1 European countries do not have a 4m allocation so that naturally limits how many contacts can be made outside of the UK, essentially only Eire and Belgium are viable and so the fact that we didn’t work outside the UK shouldn’t be viewed as a failing.
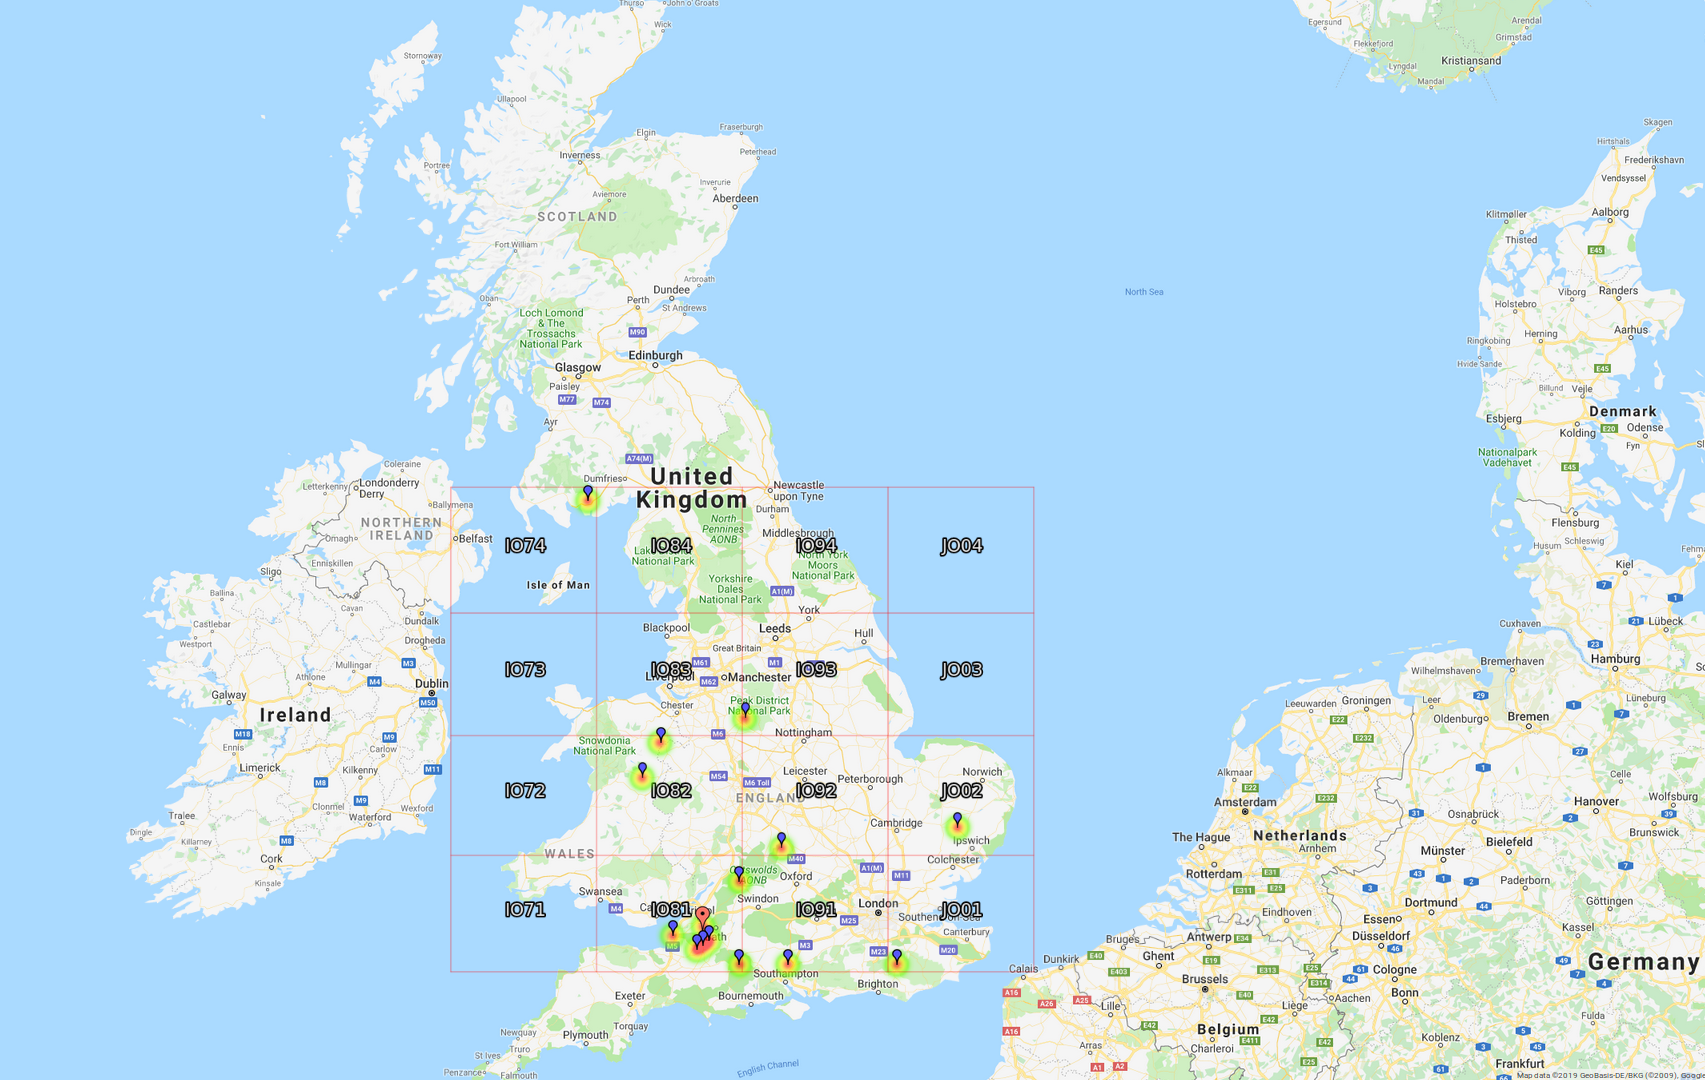
Location of Stations Worked on 4m
Submitted Log
Below is the full log submitted following participation in this years event. If any information is received post submission updates will appear in the “Notes” column.
We normally get round to uploading our Field Day contest logs to eQSL.cc, but otherwise do not exchange QSL cards in this event. If you wish to QSL traditionally please send information via the RSGB Bureau.
